The Uninsured Population in 2026: What Policy Professionals Need to Know
A data-driven breakdown of coverage losses, projected trends, and the policy levers that could reshape health insurance access.
By Carrie HirschReviewed by PAP Editoral TeamUpdated June 24, 202625+ min read
What you’ll learn in this article…
CBO projects 30 million people will be uninsured in 2026, a jump of 3.4 million from the prior year.
Medicaid unwinding, subsidy expiration, and 2025 reconciliation law changes are the three converging drivers of coverage loss.
Non-expansion states concentrate the highest uninsured rates, leaving low-income adults without viable public or private options.
CBO projects over 14 million additional uninsured individuals by 2034, demanding proactive administrative planning now.
In 2024, the U.S. uninsured rate rose for the first time since 2019, reversing years of historic coverage gains. The Congressional Budget Office now projects 30 million people will lack health insurance in 2026, a jump of 3.4 million in a single year.
The timing is not coincidental. Three forces converge in 2026: Medicaid unwinding has already stripped millions from public coverage, enhanced ACA premium tax credits face expiration, and changes embedded in the 2025 reconciliation law's health policy impacts narrow eligibility for both Medicaid and Marketplace plans. For state and federal administrators, each of these shifts compounds the others, creating coverage gaps that disproportionately hit low-income populations in non-expansion states.
The policy window for mitigating these losses is narrow, and it is closing.
How Many People Are Projected to Be Uninsured in 2026?
The Congressional Budget Office (CBO) projects that 30 million people will be uninsured in 2026, representing an uninsured rate of 10.0 percent among the nonelderly population.1 This marks an increase of 3.4 million uninsured individuals from the previous year,2 reflecting the ongoing effects of the Medicaid unwinding and the scheduled expiration of enhanced Affordable Care Act (ACA) marketplace subsidies. The CBO's baseline, issued in February 2026, uses current law as its foundation, meaning it assumes no new legislative changes after that date.
How CBO's Baseline Differs from Other Forecasts
Other prominent models yield slightly different estimates. The Urban Institute's Health Insurance Policy Simulation Model (HIPSM), for example, often produces a higher or lower uninsured figure depending on assumptions about marketplace participation and employer coverage. In recent cycles, the Urban Institute's projections have sometimes shown a more optimistic picture if they assume greater uptake of subsidies, while the CBO tends to incorporate more conservative behavioral responses. For health policy masters programs and analysts working on coverage legislation, the CBO number carries special weight because it serves as the official score for congressional budget resolutions and reconciliation legislation. Thus, the 30 million figure is the benchmark for evaluating proposals that might expand or cut coverage.
2026 as a Waypoint on a Rising Trajectory
The CBO's long-term outlook extends through 2034, and the 2026 estimate is not a peak. By 2034, the CBO projects over 14 million more people will be uninsured compared to current levels,1 driven by the combined effect of Medicaid eligibility redeterminations, state-level coverage changes, and the expiration of the enhanced premium tax credits that have temporarily lowered marketplace costs. The 2026 figure already reflects a substantial erosion of coverage: the uninsured rate has climbed back above 10 percent for the first time in years. Looking ahead, each successive year is expected to add to the uninsured total unless lawmakers intervene.
Historical Context: Still Below Pre-ACA Levels but Losing Ground
Although 30 million uninsured is a stark number, it remains well below the 44 to 46 million uninsured (about 16 to 17 percent of the nonelderly) recorded in the years before the ACA's major coverage expansions took effect in 2014. The current level is roughly two-thirds of that pre-ACA peak, underscoring the law's lasting structural impact. However, the gap is narrowing. A review of trump health policy impact on insurance coverage helps illustrate how recent executive and legislative decisions have accelerated that narrowing. The 3.4 million increase from 2025 to 2026 equals the coverage gains achieved in a typical year of steady ACA expansion. Public administrators and policy leaders should recognize that the 2026 number is not a static condition but a point on a worsening curve, demanding attention to coverage stability and affordability.
Comparative Forecast: CBO Vs. Urban Institute 2026 Projections
Policy administrators face a forecasting tradeoff: rely on the Congressional Budget Office's official baseline, which carries statutory weight in legislative scoring, or consult microsimulation models like the Urban Institute's Health Insurance Policy Simulation Model (HIPSM), which can stress-test alternative scenarios faster. Both are credible. They answer slightly different questions, and the gap between them is itself a planning signal.
Side-by-Side 2026 Projections
The table below compares the CBO baseline against two Urban Institute HIPSM scenarios that bracket the central policy question of 2026: whether enhanced premium tax credits (PTCs) continue or expire.1
Source
Methodology Note
Projected Uninsured (2026)
Uninsured Rate
CBO Baseline
Statutory scoring model used for legislative analysis; reflects current law including enacted 2025 reconciliation changes
Baseline projection rising toward 14+ million additional uninsured by 2034
Trending upward from 2024 levels
Urban Institute HIPSM (Enhanced PTCs Extended)
Microsimulation assuming enhanced premium tax credits continue past 2025
23.2 million
8.2%
Urban Institute HIPSM (Enhanced PTCs Expired)
Microsimulation assuming enhanced PTCs expire and standard PTCs apply
27.9 million
9.9%
The Urban Institute estimates roughly 4.8 million more people uninsured in 2026 if enhanced credits lapse, with marketplace subsidized enrollment falling from 19.0 million to 11.7 million.1
What Drives the Differences
Three modeling choices explain most of the divergence between forecasts:
Behavioral assumptions: How quickly consumers respond to higher net premiums when subsidies shrink. Urban Institute generally models sharper short-term take-up declines than CBO's smoothed estimates.
Medicaid churn modeling: HIPSM tracks transitions between Medicaid, marketplace, and uninsurance at the individual level, capturing churn that aggregate models can understate.
Scenario framing: CBO scores current law as enacted. Urban Institute publishes branching scenarios, which is useful when administrators need to plan for legislative contingencies that have not yet been settled.
For state Medicaid directors and exchange administrators, the practical guidance is to plan against the higher Urban Institute figure while budgeting against the CBO baseline. think tank analyst roles at organizations like the Urban Institute are specifically designed to produce these scenario-based forecasts that inform real-time administrative decision-making.
Why the Uninsured Population Is Increasing: Key Policy Drivers
What specific policy changes are causing millions of Americans to lose health coverage in 2026? Three major legislative and administrative shifts converge this year to drive the largest sustained increase in uninsurance since the Affordable Care Act's coverage expansions took effect: the conclusion of Medicaid unwinding disenrollments, the expiration of enhanced premium tax credits for Marketplace coverage, and structural changes embedded in the 2025 budget reconciliation law. Unlike market-driven downturns or economic recessions, these coverage losses stem directly from deliberate policy choices, making them both predictable and amenable to administrative intervention.
Medicaid Unwinding: Procedural Disenrollments at Scale
The single largest driver of coverage loss stems from the Medicaid unwinding process that began in April 2023. States resumed eligibility redeterminations for the first time in three years, having been prohibited from disenrolling anyone during the COVID-19 public health emergency. By the end of 2024, nearly all states had completed renewals for their entire Medicaid population.1 Millions of enrollees were disenrolled during this process, many for procedural reasons such as outdated contact information, incomplete paperwork, or failure to return renewal forms rather than confirmed ineligibility. These disenrollments concentrated among working adults, parents in low-income families, and children whose coverage lapsed when automatic renewals were discontinued. The majority of individuals losing Medicaid do not have access to affordable employer-sponsored coverage, leaving them to navigate the individual Marketplace or go uninsured.
Enhanced Premium Tax Credits: The Affordability Cliff
The second major driver is the scheduled expiration of enhanced Marketplace premium tax credits. These enhanced subsidies, extended through 2025, made coverage significantly more affordable for middle-income households and eliminated premium contributions entirely for many low-income purchasers. Without congressional action to extend them, millions of Marketplace enrollees will face sharp premium increases in 2026. The Congressional Budget Office estimates that a substantial portion of the 14 million additional uninsured projected by 2034 will result from individuals dropping coverage when subsidies revert to pre-enhancement levels.1 For households earning between 200 percent and 400 percent of the federal poverty level, monthly premiums could double or triple, pushing coverage out of financial reach even as they remain technically eligible for Marketplace plans.
The 2025 Reconciliation Law: Structural Retrenchment
Changes embedded in the 2025 budget reconciliation law further compound coverage losses. These legislative modifications tightened Medicaid eligibility standards in several states, restricted access to certain Marketplace plans, and altered income verification procedures in ways that create new administrative barriers. Trump health policy's impact on insurance coverage is examined closely in a companion review that tracks how second-term executive and legislative actions are reshaping enrollment across programs. While the full impact will unfold over multiple years, initial effects are already visible in 2026 enrollment data.
Structural Fragmentation and Life Transitions
Underlying all three drivers is the fundamental fragmentation of the U.S. health insurance system. Unlike integrated national systems, American coverage is structured as a patchwork of employer plans, public programs with categorical eligibility rules, and means-tested subsidies, each with distinct income thresholds, documentation requirements, and enrollment periods. When individuals experience common life transitions such as job changes, income fluctuations, family status shifts, or aging out of parental coverage, they often fall through the gaps between programs. A worker who loses employer coverage mid-year may miss the Marketplace special enrollment window, while a parent whose income rises slightly above Medicaid thresholds may find subsidized Marketplace coverage unaffordable. These are policy-designed vulnerabilities, not inevitable market outcomes, and they can be addressed through administrative reforms such as automatic enrollment transfers, continuous eligibility periods, and simplified verification processes. Professionals pursuing health policy masters programs gain direct grounding in designing exactly these kinds of structural fixes.
The 2024 uptick in the uninsured rate is not a statistical anomaly. It reflects a structural reversal driven by overlapping forces: Medicaid unwinding removing millions from public coverage, enhanced Marketplace subsidies failing to reach everyone who lost that coverage, and a fragmented system ill-equipped to manage large-scale eligibility transitions without leaving people behind.
Medicaid Unwinding and Its Ongoing Impact on Coverage
What Is Medicaid Unwinding?
Medicaid unwinding refers to the process states used to resume eligibility checks for all Medicaid enrollees after a three-year pause during the COVID-19 public health emergency. Starting in April 2023, states began reviewing the coverage of more than 94 million people. By the end of 2024, nearly all states had completed those renewals.1 The goal was to ensure that only those who still qualified remained covered, but the sheer scale and speed of redeterminations led to millions losing coverage , many for procedural reasons rather than actual ineligibility.
Disenrollment by the Numbers
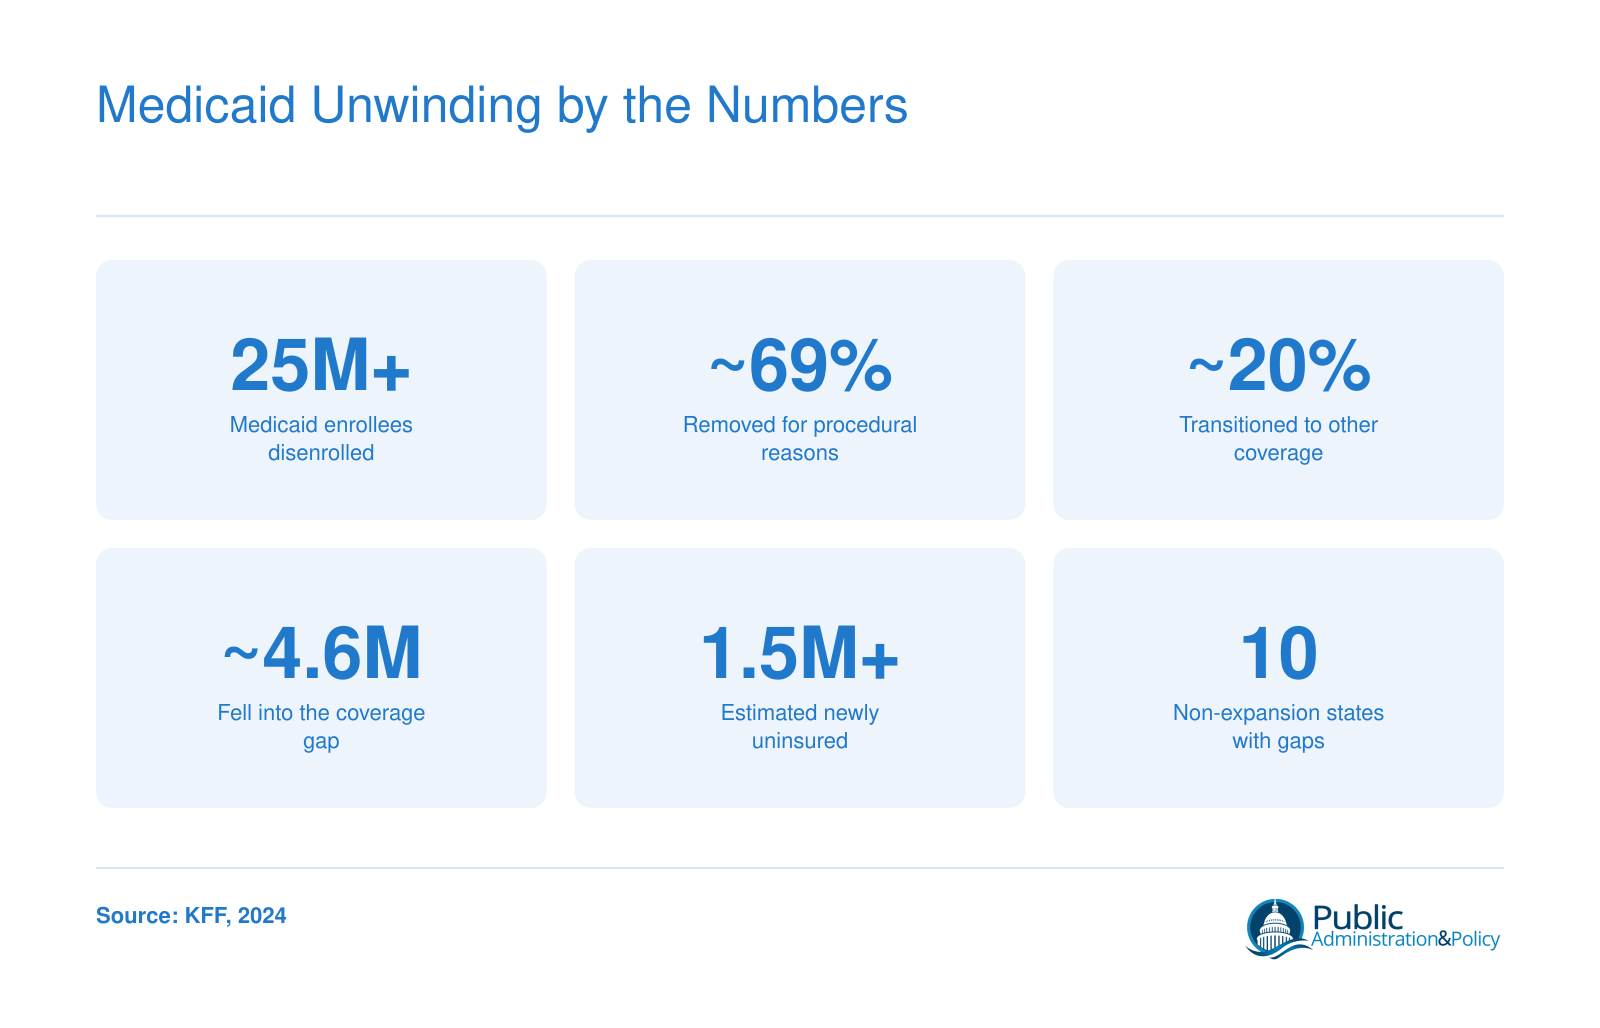
Between April 2023 and late 2024, cumulative disenrollments from Medicaid reached approximately 25.2 million nationally.2 Of the 94.3 million renewals due, about 55.1 million enrollees were reenrolled successfully.1 The median state saw a net enrollment decline of 13.9% during this period.3 Research from the KFF Medicaid Enrollment and Unwinding Tracker shows that 69% of disenrollments were classified as procedural, meaning paperwork issues, missed deadlines, or outdated contact information, while only 31% were determined to be ineligible.2 This imbalance underscores a systemic challenge: many people lost coverage not because they didn't qualify, but because they couldn't navigate renewals.
Procedural Disenrollments and Administrative Burden
The high rate of procedural disenrollments points to administrative fragility. Early in 2023, procedural terminations accounted for nearly 79% of losses; by late 2024, that share dropped to about 65% as states improved outreach.1 Still, millions fell through the cracks. According to a JAMA Health Forum analysis, 23% of those disenrolled became uninsured, while 77% transitioned to other coverage, often through employers or the ACA Marketplace.3 Nevertheless, most individuals losing Medicaid do not have access to affordable job-based coverage, and transitions remain uneven. Continued administrative challenges, including outdated eligibility systems and inadequate staffing, are expected to carry enrollment churn into 2026.
The Coverage Gap in Non-Expansion States
Ten states have not expanded Medicaid under the ACA, leaving many low-income adults in a coverage gap. They earn too much to qualify for traditional Medicaid but too little to receive Marketplace subsidies. During unwinding, these individuals faced an even narrower safety net. Without expansion, many who lost Medicaid had no realistic alternative, deepening long-standing disparities. The Commonwealth Fund notes that policies like continuous eligibility could reduce churn by 30%, and estimates suggest such approaches could prevent coverage loss for roughly 267,000 adults per month.4 For public policy making professionals and administrators, improving coordination between Medicaid and Marketplace systems remains a critical lever to prevent future coverage losses.
Medicaid Unwinding by the Numbers
The Medicaid unwinding process, which began in April 2023 as states resumed eligibility redeterminations paused during the pandemic, reshaped coverage for millions of enrollees. By the end of 2024, nearly all states had completed renewals. The scale of disenrollment and the gaps it exposed remain central challenges for public administrators working to maintain coverage continuity.
ACA Marketplace Subsidies: What Happens When Enhanced Credits Expire?
Affordability versus access is the central tension governing the future of ACA Marketplace coverage. The enhanced premium tax credits introduced under the American Rescue Plan temporarily reshaped who could afford Marketplace insurance, and whether those credits remain in place or expire will determine coverage outcomes for millions of Americans in 2026 and beyond.
What the Enhanced Credits Changed
Before the enhanced credits took effect, the original ACA subsidy structure imposed a hard income cliff at 400 percent of the federal poverty level. Households above that threshold received no assistance, regardless of how much of their income a Marketplace plan consumed. The enhanced credits removed that cliff, capped premium contributions at 8.5 percent of income across all income levels, and extended meaningful subsidies to middle-income enrollees who had previously found Marketplace coverage out of reach.1
The result was a significant expansion in affordability, particularly for self-employed workers, early retirees, and households in states that declined to expand Medicaid. Enrollment surged, and the uninsured rate reflected those gains.
The Expiration Scenario
If the enhanced credits expire as scheduled, projections from the Robert Wood Johnson Foundation indicate that approximately 4.2 million people could become uninsured as a direct consequence.2 Marketplace enrollees without access to employer-sponsored coverage would face premium increases estimated at between 75 and 114 percent compared to what they currently pay under the enhanced structure.3
The populations most exposed to this disruption are low- and middle-income households enrolled in Marketplace plans, particularly those who earn too much to qualify for Medicaid but not enough to absorb sudden premium spikes. In non-expansion states, where the coverage gap already leaves low-income adults without any affordable option, the stakes are especially high.
The Policy Calculus for Administrators
For state and federal administrators, the expiration question is not abstract. It translates directly into projected call volumes at enrollment assistance centers, redetermination caseloads, and uncompensated care costs for safety-net providers. States that built outreach capacity around enhanced-credit enrollment now face planning decisions about whether to sustain that infrastructure or scale it back.
Public administrators working on public policy consulting roles or health coverage portfolios should consult the KFF ACA Enhanced Premium Tax Credit Calculator to model income-specific affordability shifts.1 These tools translate legislative scenarios into household-level impacts, which is the level of detail administrators need to design effective transition support.
The CBO's broader projection that over 14 million more people will be uninsured by 2034 under current legislative changes reflects a compounding effect: Medicaid unwinding, eligibility restrictions, and subsidy expiration do not operate in isolation.4 For policy design purposes, the subsidy question is one lever among several, but it is a lever with unusually direct and measurable consequences for near-term coverage continuity.
Questions to Ask Yourself
Does your state have a documented plan for transitioning Medicaid disenrollees into Marketplace coverage?
Without a warm handoff between agencies, most disenrollees fall into the uninsured pool rather than picking up subsidized plans. The presence or absence of this workflow is often the single biggest predictor of post-unwinding coverage retention.
What administrative barriers in your agency's redetermination process are driving procedural disenrollments?
Missing renewal forms, outdated addresses, and call center backlogs strip coverage from people who remain eligible. Auditing these friction points reveals where modest process fixes could prevent thousands of avoidable losses.
If enhanced premium tax credits expire, how will your state's uninsured rate shift relative to neighboring states?
Non-expansion states and those with thinner outreach infrastructure will see sharper spikes. Benchmarking against regional peers helps policy leaders model the political and fiscal exposure of inaction.
Who Is Most Likely to Be Uninsured? Demographics and Disparities
States that expanded Medicaid under the ACA and states that did not have created two fundamentally different coverage landscapes, with uninsurance concentrated heavily in regions where policy decisions left low-income residents without viable options.
Race, Ethnicity, and Income Disparities
The uninsured population does not reflect a random cross-section of Americans. Hispanic adults face disproportionately high uninsured rates, followed by Black adults, while white and Asian populations generally maintain higher coverage levels. These disparities persist even when controlling for employment status, reflecting structural barriers including immigration status restrictions, language access challenges, and geographic concentration in states with weaker safety nets.
Income level remains the strongest predictor of uninsurance. Individuals and families earning below 200 percent of the federal poverty level constitute the majority of the uninsured population. This group often earns too much to qualify for Medicaid in non-expansion states yet too little to afford marketplace premiums or employer-sponsored coverage, even with subsidies. The result is a persistent coverage gap that policy design has failed to close.
Age and the Young Adult Challenge
Young adults between ages 19 and 34 represent a disproportionate share of the uninsured. Several factors converge in this demographic. Many age out of parental coverage at 26, work in industries with low rates of employer-sponsored insurance, and face competing financial pressures that make even subsidized premiums feel unaffordable. This cohort also tends to perceive lower immediate health risks, leading some to forgo coverage despite eligibility.
The Geographic Divide: Non-Expansion States
Perhaps no factor shapes uninsurance patterns more clearly than state-level Medicaid expansion decisions. Southern states that have not expanded Medicaid consistently report uninsured rates far exceeding the national average. Texas, Florida, and Georgia alone account for a substantial portion of the national uninsured population. In these states, adults earning below the poverty line often have no public coverage pathway, and marketplace subsidies provide insufficient support for those just above.
Working Families and Employer Coverage Gaps
Contrary to common assumptions, most uninsured individuals live in working families. The problem is not unemployment but rather the nature of available employment. Many jobs, particularly in retail, food service, agriculture, and gig economy sectors, either do not offer health benefits or offer plans with premiums and deductibles that workers cannot realistically afford. Labor demand policies and employer benefit structures interact in ways that leave these families caught between the limitations of public programs and the absence of affordable job-based coverage.
These demographic patterns are not accidents of the marketplace. They follow directly from Medicaid expansion decisions, employer benefit structures, and subsidy levels set by federal legislation. Public administrators analyzing coverage gaps must recognize that the current distribution of uninsurance reflects deliberate policy architecture, which means different policy choices could produce different outcomes. Professionals pursuing a masters degree in health policy are increasingly positioned to address exactly these structural design questions.
Economic and Health Consequences of Rising Uninsurance
The central tension here is straightforward: the short-term cost of covering people is consistently smaller than the long-term cost of not covering them. That gap shows up in medical debt, emergency rooms, delayed diagnoses, and the public budgets that absorb what private insurance does not.
Medical Debt and Its Ripple Effects
Uninsured individuals face medical costs with no negotiated rates and no insurer to distribute risk. The predictable result is debt. Research has consistently found that uninsured adults are far more likely to carry medical debt than their insured counterparts, and that debt does not stay inside the healthcare system. It flows into credit reports, affects housing applications, and depresses consumer spending at the community level. When millions of people cycle in and out of coverage, as the Medicaid unwinding process produced between 2023 and 2024, the aggregate credit impact across low-income communities becomes a measurable drag on local economies.
Emergency Departments as Default Primary Care
Without a usual source of care, uninsured patients frequently turn to emergency departments for conditions that could have been managed in a clinic. According to data compiled by KFF, roughly 40.8 percent of uninsured adults reported having no usual source of care in 2024,1 and 46.2 percent had not seen a doctor at all in the prior year.1 Emergency visits for preventable conditions cost significantly more than outpatient care, and hospitals absorb a large share of that cost as uncompensated care. Safety-net hospitals and federally qualified health centers carry a disproportionate share of this burden, often with reimbursement structures that do not fully offset the volume.
Delayed Care and Chronic Disease Costs
The downstream consequences of foregone care are where costs compound most seriously. Nearly 38.6 percent of uninsured adults reported delaying or forgoing needed care due to cost in 2024,1 and 22 percent of uninsured non-elderly adults went without needed care entirely as recently as 2022.2 Conditions that are manageable with early intervention, including diabetes, hypertension, and certain cancers, become far more expensive to treat when a patient arrives at a later stage. For public policy makers, this means higher acuity caseloads at community health centers and greater demand on Medicaid once individuals eventually re-enroll.
Fiscal Pressure on Local and State Governments
Rising uninsurance does not simply shift costs to individuals. It shifts costs to governments. Local health departments, public hospital systems, and state Medicaid programs all experience increased demand when the uninsured rate climbs. With the Congressional Budget Office projecting that over 14 million more people could be uninsured by 2034 due to subsidy expirations and Medicaid eligibility changes,3 public administrators should treat the current period as a planning signal, not a stable baseline. The fiscal exposure for states that did not expand Medicaid is particularly acute, since their safety-net infrastructure already operates under greater strain and their residents have fewer fallback options when private coverage becomes unaffordable.
The CBO projection of over 14 million additional uninsured people by 2034 reflects a structural policy trajectory, not a temporary fluctuation. Public administrators at every level must begin planning now for sustained increases in uncompensated care demand, eligibility transitions, and safety-net strain driven by changes to both Medicaid and Marketplace coverage rules.
Policy Solutions and the Role of Public Administrators
State-Level Strategies to Stabilize Coverage
State administrators hold significant leverage to reduce uninsured rates through targeted operational improvements. One high-impact tactic is auto-enrollment, which uses data from Medicaid eligibility systems to seamlessly transfer individuals who become ineligible for Medicaid into Marketplace plans. This approach, sometimes called "express lane" enrollment, prevents churn that occurs when someone loses Medicaid but misses the window to enroll in subsidized private coverage. Early adopters report reductions in coverage gaps of up to 30 percent among transition populations.
Streamlined redetermination processes are equally critical. By adopting ex parte renewals, where eligibility is verified using available data without requiring beneficiary action, states can slash the procedural disenrollments that drove much of the recent coverage loss. States that invested in integrated eligibility systems and pre-populated renewal forms saw significantly lower unwinding-related disenrollment. Additionally, a handful of states have piloted state-funded bridge coverage programs that offer temporary, low-cost insurance to individuals caught in the gap between Medicaid and Marketplace eligibility, providing continuity of care during transitions.
Federal Levers to Address the Coverage Gap
At the federal level, the most immediate lever is extending the enhanced premium tax credits (PTCs) that were introduced under the American Rescue Plan and later extended. These credits reduce monthly premiums for Marketplace enrollees, with the largest effect on middle-income households that previously received little or no subsidy. The Congressional Budget Office projects that permanent extension would prevent millions from becoming uninsured over the next decade, particularly as the enhanced subsidies are set to expire.1
Closing the Medicaid coverage gap in the ten remaining non-expansion states would have an outsized impact. In these states, adults with incomes below the poverty line earn too much for traditional Medicaid but too little to qualify for Marketplace subsidies, leaving them with no affordable option. Federal legislation or waiver-based incentives could compel expansion, and public administrators at Centers for Medicare and Medicaid Services play a key role in designing such incentives and supporting state implementation. Continuous eligibility policies, which guarantee 12-month coverage for children or new mothers regardless of income fluctuations, are another evidence-backed federal strategy that stabilizes coverage.
Best Practices for Efficient Administration
Behind every policy lies the administrative infrastructure that determines whether it reaches people. Data-sharing agreements between state Medicaid agencies and Marketplace exchanges are foundational: when these systems can exchange eligibility files in near real time, individuals move between programs without needing to reapply. Reducing procedural disenrollments, those caused by missed paperwork rather than true ineligibility, requires user-centered design in correspondence, simplified renewal notices, and multiple touchpoints via text, email, and phone.
Proactive outreach to at-risk populations, including those with limited English proficiency, rural residents, and people of color, further narrows the equity gap. Effective administrators use predictive analytics to identify enrollees most likely to lose coverage and deploy community-based navigators to assist them. These practices are not only cost-effective but also demonstrably improve population health outcomes.
Career Pathways for Public Administration Professionals
These challenges sit squarely within the domain of public administration careers. State health agencies need policy analysts who can design auto-enrollment algorithms and evaluate waiver outcomes. CMS regional offices hire program specialists to oversee state compliance with federal renewal standards and to manage innovation grants. Nonprofit advocacy organizations employ MPA-trained researchers to track uninsured trends and draft model legislation. For those entering the field, the operational realities of Medicaid unwinding, subsidy administration, and eligibility modernization offer a career path defined by tangible impact, closing coverage gaps and making health systems work for everyone.
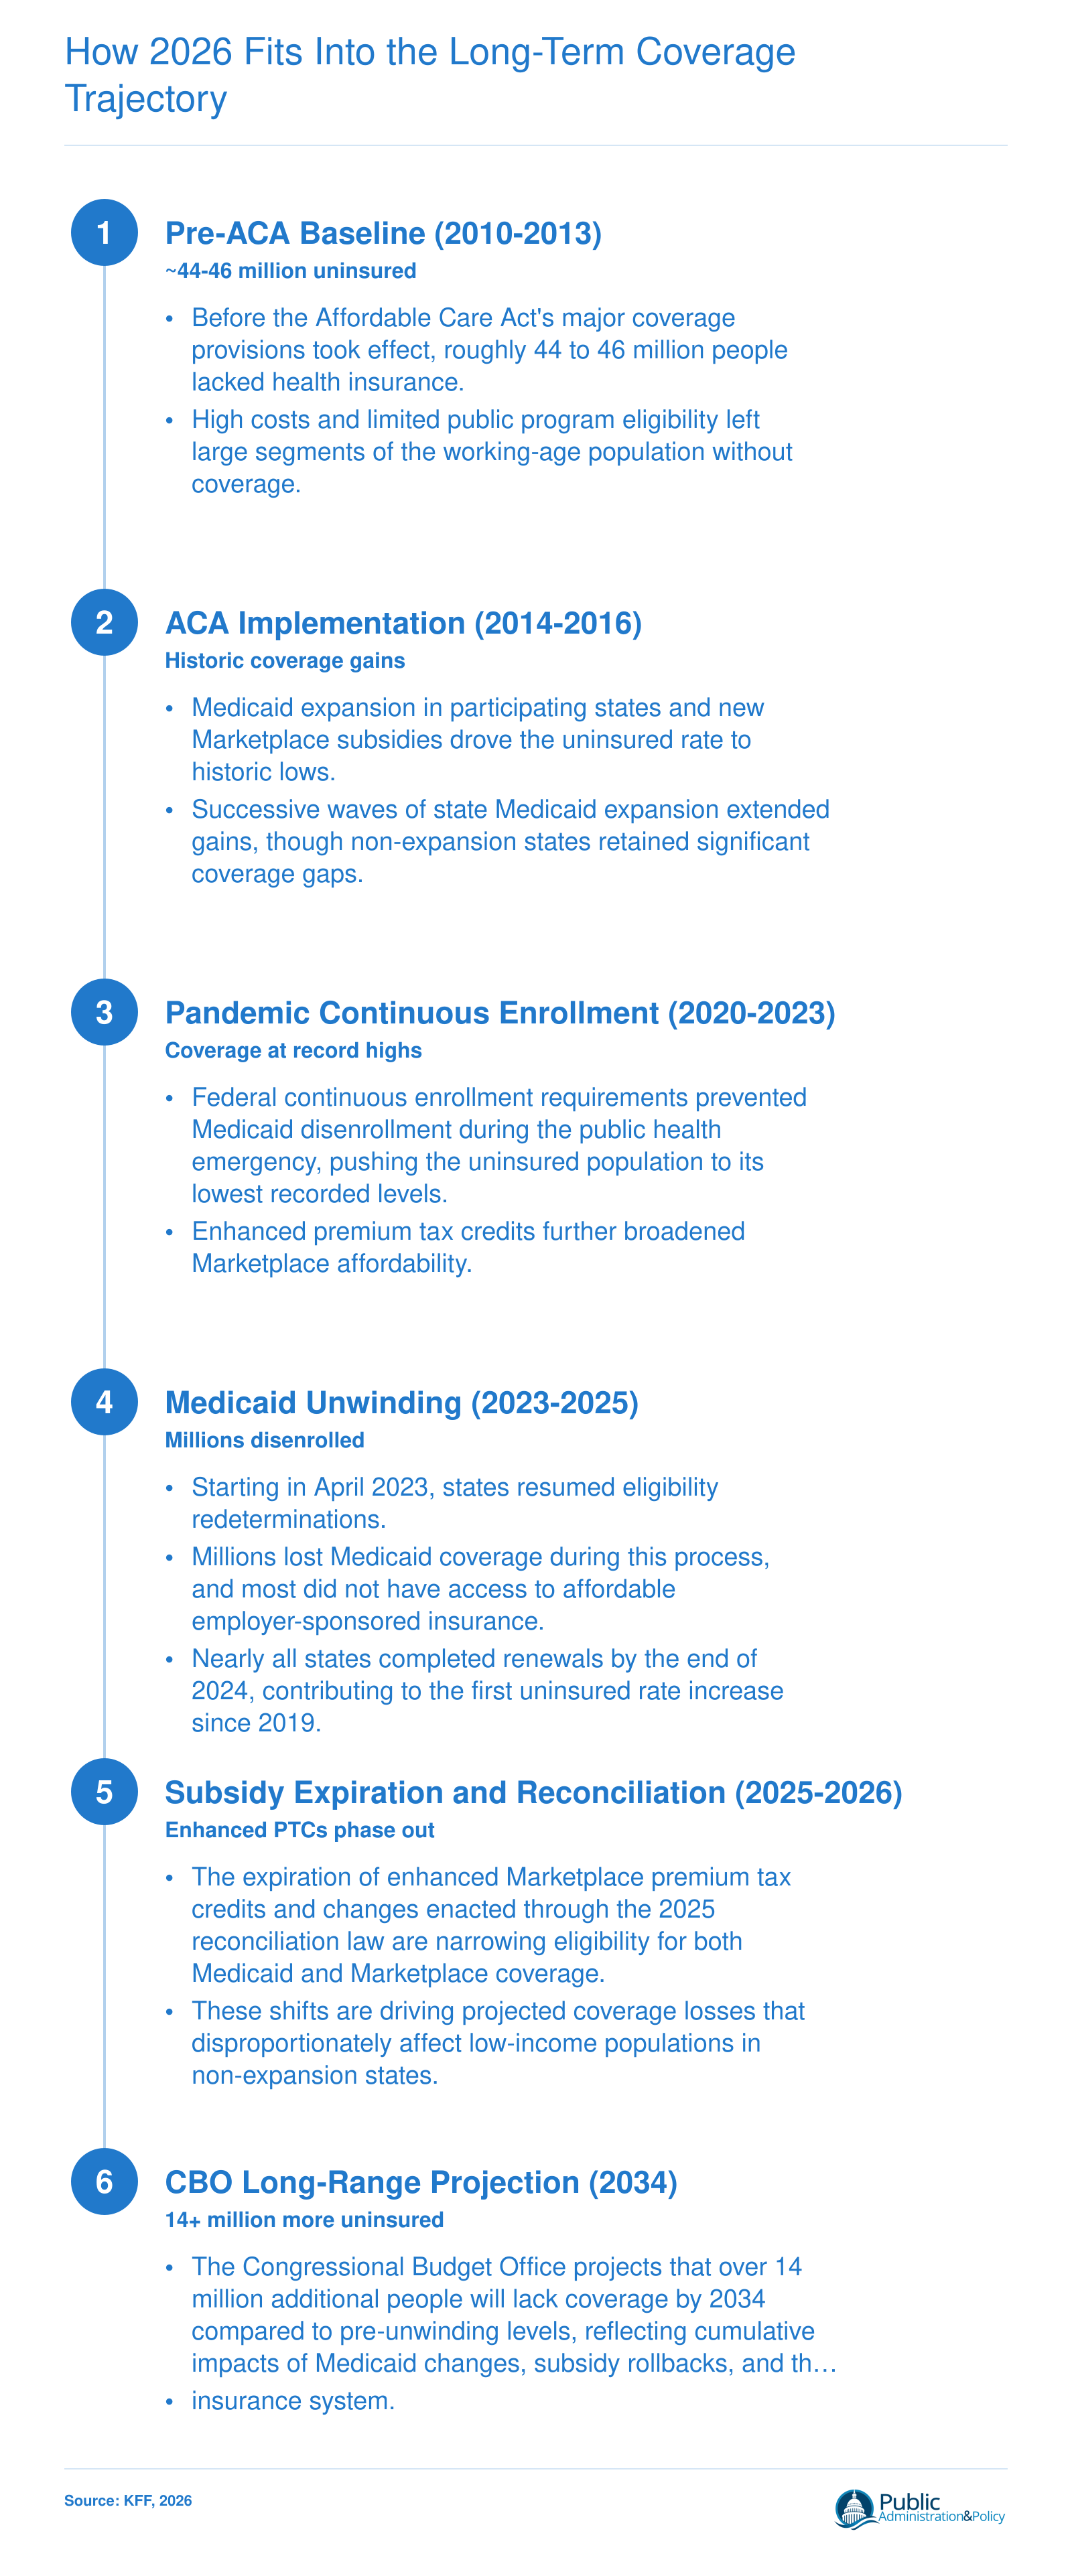
How 2026 Fits Into the Long-Term Coverage Trajectory
The number of uninsured Americans has followed a dramatic arc shaped by landmark legislation, emergency measures, and their subsequent rollback. Understanding this trajectory helps public administrators and policy professionals anticipate where coverage gaps will emerge next and design interventions accordingly.
Frequently Asked Questions About the 2026 Uninsured Population
Below are answers to the most common questions about the projected uninsured population in 2026. Each response draws on data and analysis discussed throughout this article, including Congressional Budget Office projections, KFF research, and the policy dynamics shaping coverage trends.
How many people are projected to be uninsured in 2026?
Exact 2026 figures depend on legislative developments still unfolding, but the Congressional Budget Office projects a steep upward trajectory. The CBO estimates that over 14 million additional people will lack coverage by 2034 compared to pre-unwinding baselines, driven by Medicaid eligibility changes, the expiration of enhanced Marketplace subsidies, and provisions in the 2025 reconciliation law. The 2026 count sits early on that escalating curve, with millions already affected by Medicaid disenrollments completed by the end of 2024.
What is the economic impact of the uninsured on the community?
Uninsured individuals delay or forgo care, which increases reliance on emergency departments and drives up uncompensated care costs absorbed by hospitals and local governments. Communities with higher uninsured rates often face reduced workforce productivity, greater financial instability among households, and strained public health systems. For public administrators, these costs translate into larger safety-net budgets and more complex service delivery challenges, particularly in states that have not expanded Medicaid.
Which population is most likely to be uninsured?
Low-income adults in states that have not expanded Medicaid face the highest risk, particularly those earning too much for traditional Medicaid but too little to qualify for Marketplace subsidies. Hispanic and Latino communities, young adults, and people working in industries that rarely offer employer-sponsored coverage are also disproportionately affected. The coverage gap in non-expansion states leaves millions without any affordable option, a structural problem that persists into 2026.
How many people were uninsured before the Affordable Care Act?
Before the ACA's major coverage provisions took effect in 2014, approximately 44 million nonelderly Americans lacked health insurance. The law's Medicaid expansion and subsidized Marketplace plans cut the uninsured rate significantly. However, the gains achieved over the past decade are now at risk as enhanced premium tax credits face expiration and Medicaid unwinding has already reversed some progress, pushing the uninsured rate upward for the first time since 2019.
How does Medicaid unwinding affect the number of uninsured Americans?
Beginning in April 2023, states resumed verifying Medicaid eligibility after a pandemic-era pause on disenrollments. Millions of enrollees were removed from Medicaid rolls during this process, and nearly all states had completed renewals by the end of 2024. Many of those disenrolled did not transition to other coverage because they lacked access to affordable employer-sponsored insurance or could not navigate Marketplace enrollment. This administrative churn directly contributed to the first increase in the uninsured rate since 2019.
What policy changes are driving the increase in the uninsured population?
Three converging factors stand out. First, Medicaid unwinding removed millions from public coverage. Second, the scheduled expiration of enhanced ACA premium tax credits will make Marketplace plans unaffordable for many enrollees. Third, the 2025 reconciliation law includes provisions that further tighten Medicaid eligibility and reduce Marketplace support. Together, these changes represent a significant policy shift that the CBO projects will leave over 14 million more people uninsured by 2034, making proactive administrative responses essential.