Public Administration & Policy Salaries: What You Can Realistically Expect
Comprehensive salary data by role, education level, sector, and region — plus how benefits shape total compensation
By Max SheltonReviewed by PAP Editoral TeamUpdated June 18, 202625+ min read
What you’ll learn in this article…
Median salaries for core public administration roles range from $77,000 to $128,000 depending on position and sector.
Federal employees typically earn $10,000 to $30,000 more than state or local counterparts in the same role.
An MPA or MPP holder can expect 20 to 35 percent higher lifetime earnings compared to a bachelor's degree alone.
Total government compensation, including pensions, health coverage, and loan forgiveness, can rival private sector packages worth $110,000 or more.
Median salaries for core public administration jobs range from roughly $77,000 to $128,000 a year, but that spread widens considerably once you factor in degree level, sector, geography, and career stage. A GS-9 budget analyst in Kansas City and a senior policy director at a D.C. policy consulting firm may both hold an MPA, yet their total compensation packages can differ by $60,000 or more.
The assumption that government pay consistently trails the private sector is common and, in many cases, outdated. When you stack defined-benefit pensions, employer health insurance subsidies, and Public Service Loan Forgiveness against a higher base salary with modest 401(k) matching, the gap narrows or reverses entirely for many mid-career professionals. The real calculus depends on which tradeoffs you prioritize and how long you plan to stay.
Average Public Administration & Policy Salaries by Role
Across the broad landscape of careers in public administration, median salaries generally fall between $77,000 and $128,000 per year, depending on the specific role, level of responsibility, and whether the position sits in government, the nonprofit sector, or private consulting. That range is wider than many candidates expect, so the most useful way to evaluate your earning potential is to drill into individual job titles.
Below you will find salary data for 10 common occupational categories tracked by the Bureau of Labor Statistics, followed by notes on additional roles whose pay data is drawn from related BLS categories rather than a single dedicated code.
Core Public Administration & Policy Roles
Political Scientist: Median $128,020; 10th percentile $64,860, 90th percentile $183,110. This is the highest-paying dedicated public policy role on the list, though it is also one of the smallest in total employment (roughly 5,000 positions nationwide).1
Compensation and Benefits Manager: Median $136,380; 10th percentile $76,550, 90th percentile $229,970. Often found leading pay-equity and workforce policy in large agencies, this role commands the single highest median wage among the categories covered here.2
Administrative Services Manager: Median $101,870; 10th percentile $64,850, 90th percentile $172,920. These managers oversee agency operations, facilities, and support services, and the role employs more than 370,000 people nationally.1
Management Analyst: Median $101,190; 10th percentile $59,720, 90th percentile $174,140. With over one million workers in this category, it is the largest occupational group on the list and the one that most frequently maps to titles like "policy analyst" and "program analyst" inside government.3
Budget Analyst: Median $85,990; 10th percentile $55,220, 90th percentile $128,190.1
Urban and Regional Planner: Median $81,180; 10th percentile $49,500, 90th percentile $126,390.1
Compliance Officer: Median $78,240; 10th percentile $44,730, 90th percentile $129,210.1
Social and Community Service Manager: Median $77,030; 10th percentile $46,550, 90th percentile $123,470.1
Public Relations Specialist: Median $67,440; 10th percentile $38,250, 90th percentile $128,190. In the public sector these professionals typically carry titles like "public affairs specialist" or "communications director."1
All wage figures above are drawn from the Bureau of Labor Statistics Occupational Employment and Wage Statistics program, with the management analyst data reflecting 2024 estimates and the remaining roles reflecting 2023 estimates.
Where Do Other Job Titles Fit?
If you have searched for salaries tied to titles like city manager, program director, legislative analyst, nonprofit executive director, or government HR specialist, you may have noticed that BLS does not publish a separate occupational code for each of those roles. Instead, many real-world public administration titles map to broader BLS categories:
City managers and program directors typically fall under the management analyst or social and community service manager categories, depending on whether the role emphasizes strategic consulting or direct service oversight.
Legislative analysts and policy advisors are most closely aligned with the political scientist or management analyst categories.
Nonprofit executive directors often appear in the social and community service manager data, though compensation at larger organizations can rival administrative services manager wages.
Government HR specialists are captured within broader human resources categories; those who rise to manage compensation and benefits policy may see earnings closer to the compensation and benefits manager figures above.
Which Public Administration Job Pays the Most?
Searchers frequently ask this question, and the answer depends on how you define the field. Among roles squarely within public policy analysis, political scientists earn the highest median wage at roughly $128,000.1 If you broaden the lens to include administrative leadership, compensation and benefits managers top the chart with a median above $136,000.2 At the 90th percentile, that role reaches nearly $230,000, reflecting the premium placed on senior leaders who shape workforce policy across large agencies or organizations.
Keep in mind that percentile ranges matter as much as medians. A budget analyst at the 90th percentile ($128,190) earns more than a social and community service manager at the same percentile ($123,470), even though the two roles sit at different median points. Your actual trajectory will depend on geography, sector, education level, and years of experience, all of which are explored in the sections that follow.
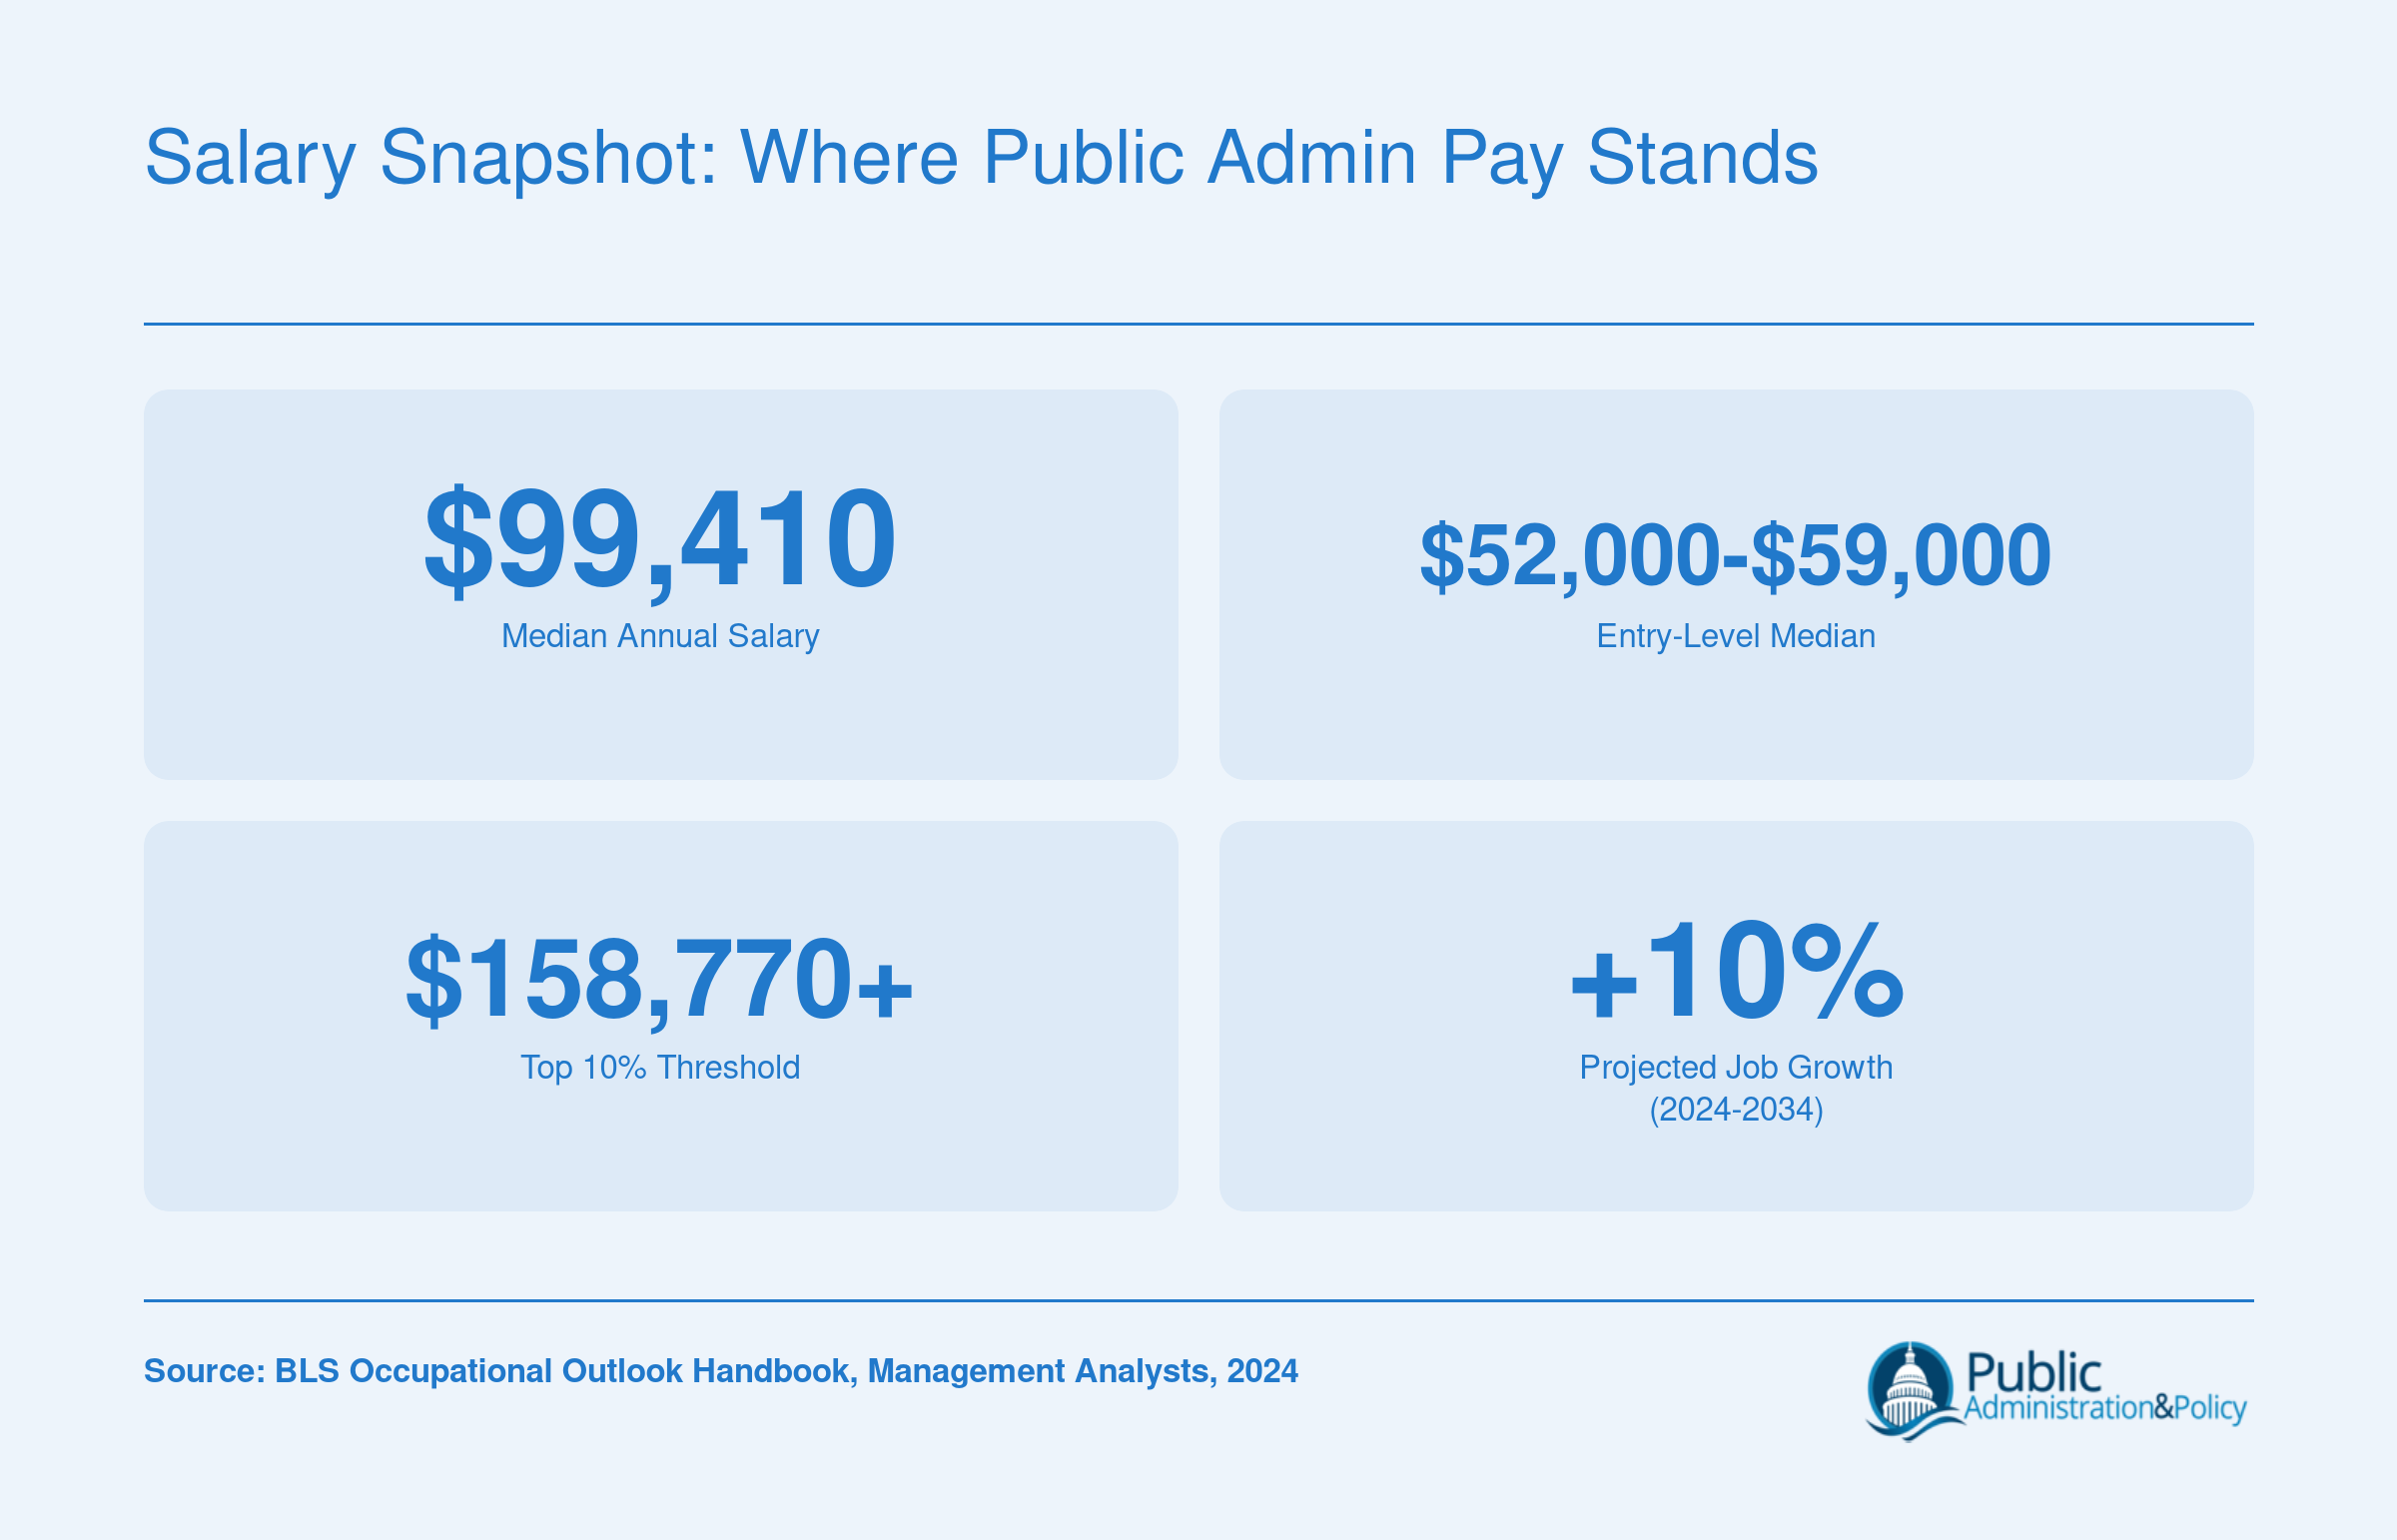
Salary Snapshot: Where Public Admin Pay Stands
Before diving into the detailed breakdowns by role, education, and sector, here are the headline numbers that frame the public administration salary landscape. These figures reflect management analysts, a core public administration occupation tracked by the Bureau of Labor Statistics.
Salary by Education Level: Bachelor's vs MPA vs MPP vs PhD
Your education level is one of the single biggest levers you can pull to influence your starting salary and long-term earning trajectory in public administration and policy. Each degree opens a distinct set of doors, and the roles behind those doors carry meaningfully different compensation.
Typical Entry Roles by Degree
Before diving into numbers, it helps to see how employers sort candidates by credential:
Bachelor's degree: Positions such as program coordinator, junior policy analyst, or administrative specialist. These roles are operational in nature and often sit at the GS-5 through GS-7 level in federal agencies.
Master's degree (MPA or MPP): Manager, senior analyst, or program officer roles. Federal agencies typically slot MPA and MPP graduates at the GS-9 level on entry, or GS-11 for those with relevant professional experience.1
Doctoral degree (PhD or DPA): Research director, senior evaluation specialist, or tenured faculty positions. The PhD opens a fork in the road between government research leadership and academia.
Salary Bands by Education Level
Drawing on federal pay schedules, NASPAA career data, and broader compensation surveys for management occupations in government, here is where each tier generally falls:
Bachelor's holders in public administration roles typically earn between $38,000 and $55,000 in the early years of their careers. Mid-career earnings for those who stay in government management can climb into the mid-$60,000 range, though upward movement without an advanced degree can plateau.
MPA and MPP holders report salary ranges of roughly $45,000 to $75,000, according to NASPAA alumni data.1 A new MPA graduate entering federal service at a GS-9 step started at approximately $43,251 (in 2017 dollars), while those qualifying for GS-11 started near $52,329.1 Adjusted for locality pay and subsequent pay table increases, current starting salaries for these grades are higher.
PhD holders in government research or evaluation roles often earn $80,000 to $110,000, while those who pursue tenured faculty positions at research universities can see salaries ranging from $75,000 to well over $130,000 depending on institution and rank.
Roughly 50 to 55 percent of MPA and MPP alumni work in government, and another 20 to 25 percent work in nonprofit organizations, so the salary ranges above reflect the sectors where most graduates actually land.1
Is a Master's in Public Administration Worth It Salary-Wise?
The short answer is yes, for most people. MPA and MPP holders tend to earn roughly $15,000 to $25,000 more per year than bachelor's holders in comparable public sector roles. Over a 30-year career, even a conservative $15,000 annual premium translates to $450,000 in additional lifetime earnings before accounting for faster promotion timelines that a graduate credential enables.
That said, the return on investment hinges on how you finance the degree. If your employer covers tuition, or if you qualify for Public Service Loan Forgiveness after ten years of eligible payments, the net cost of a master's program drops dramatically. We dig into these financial offsets in the total compensation section later in this guide.
The PhD Split Trajectory
Doctoral holders face an unusual dynamic. In government, a PhD can actually yield a lower salary than what the same credential commands in academia or private consulting. A senior evaluation specialist at a federal agency may earn $95,000, while a peer with the same degree doing policy consulting for that agency bills at rates implying compensation well above $120,000. Faculty salaries at research universities also tend to outpace government pay at the doctoral level, especially once a professor reaches the associate or full rank. If you are considering this path, you can explore online phd in public policy programs or phd in public administration online programs to weigh your options.
This does not make a government career the wrong choice for PhD holders. Job stability, pension benefits, and mission-driven work carry real value. But if maximizing earnings is your priority, a doctorate in public policy or administration tends to pay best outside of government service.
MPA vs MPP vs MBA: How Degree Choice Affects Earnings
Choosing between a Master of Public Administration, a Master of Public Policy, and a Master of Business Administration is one of the most consequential decisions you can make for your career trajectory and earning potential. Each degree opens different doors, and the salary implications depend as much on where you work as on which diploma hangs on your wall.
How Starting Salaries Compare
Median starting salaries reflect the distinct markets each degree serves:
MBA: $120,000 to $130,000, driven largely by private-sector placement in consulting, finance, and tech management.
MPP: $70,000 to $80,000, reflecting entry into federal agencies, legislative offices, and policy research organizations.
MPA: $67,000 to $77,000, aligned with roles in city management, nonprofit leadership, and state or local government administration.
These figures draw on GMAC Corporate Recruiters Survey data for MBA graduates and NASPAA alumni surveys for MPA and MPP holders.1 The MBA number looks dramatically higher, but context matters: MBA graduates are far more likely to enter industries where compensation is structured around bonuses and equity, not base salary alone.
The MPA vs MPP Gap Is Smaller Than You Think
If you are specifically weighing an MPA against an MPP, the salary difference is often modest, typically a few thousand dollars at entry level. The gap narrows further (and sometimes reverses) at mid-career, because role and sector exert more influence on pay than the two-letter distinction between the degrees. An MPP graduate who becomes a budget director at a state agency and an MPA graduate who becomes a policy analyst at a federal department may earn nearly identical salaries. The MPA emphasizes organizational management and leadership, making it a natural fit for city managers and agency directors. The MPP leans into quantitative analysis and program evaluation, positioning graduates well for think tanks, legislative staff roles, and federal policy shops. In practice, many employers treat the two degrees as interchangeable for hiring purposes.
Where the MBA Fits Into Public Service
MBA holders who cross into the public sector tend to land in hybrid spaces: government consulting firms, defense contractors, public-private partnerships, and healthcare administration. These roles often pay 15 to 30 percent more than comparable MPA or MPP positions because they sit at the intersection of business operations and government missions. The tradeoff is real, though. Mission alignment, job stability, and access to public-sector benefits like pensions and Public Service Loan Forgiveness are typically weaker in these hybrid roles.
Beyond the Paycheck: Debt and Salary Ceilings
Average student debt also shapes the calculus:
MBA: Graduates from top programs frequently carry $100,000 or more in loans, though higher starting salaries can offset this.
MPA and MPP: Typical debt ranges from $50,000 to $80,000, but graduates working in qualifying public-service roles may discharge remaining balances after ten years through federal loan forgiveness programs.
Salary ceilings differ as well. MBA holders in the private sector can reach executive compensation packages well into six or seven figures. MPA and MPP holders who rise to senior executive service positions in the federal government or become city managers of major metropolitan areas can earn $180,000 to $250,000 or more, but the ceiling in government is structurally lower than in corporate leadership. Cornell University's comparison of these three degrees notes that the right choice depends on whether your career goals center on managing organizations, analyzing policy, or leading in the private market.1
Choosing Based on Career Goals, Not Just Salary
Rather than fixating on which degree pays the most in year one, consider the full picture:
Which sectors and roles excite you most?
How much debt are you willing to take on, and does loan forgiveness factor into your plan?
Do you value compensation ceiling or compensation stability?
For students and professionals committed to public service, the MPA and MPP both offer strong returns when measured against realistic debt loads and the total compensation packages that government and nonprofit employers provide. The MBA makes the most financial sense if your path runs through the private sector or through consulting roles that serve government clients. In every case, the degree is a launching pad, not a destiny. Your sector, geography, and career decisions after graduation will shape your earnings far more than the initials on your transcript.
Salary Differences by Sector: Federal, State, Local, Nonprofit & Private
Where you work matters just as much as what you do. A public budget analyst at a federal agency, a state department of finance, and a county government office may share the same job title, but their paychecks can look dramatically different. Federal roles consistently pay the highest among public-sector options, often 20 to 40 percent more than state or local equivalents for the same position. Understanding these sector-level gaps is essential for anyone mapping out a career in public administration.
Federal Government: The Pay Leader
Federal salaries follow the General Schedule (GS) pay system, which sets transparent base pay across 15 grades and 10 steps. As of January 2026, a mid-career professional at GS-11, Step 5 earns a base salary of roughly $72,300.1 Move up to GS-12, Step 5 and the base climbs to about $86,500. At GS-13, Step 5, often the grade for senior analysts and government program manager roles, the base reaches approximately $102,600.1
Those figures tell only part of the story. Locality pay adjustments can add 15 to 40 percent on top of base salary in high-cost metros. In the Washington-Baltimore-Arlington area, where nearly 33.94 percent locality pay applies, those same grades translate to much higher take-home numbers:2
Similar boosts apply in the San Francisco, New York, and Los Angeles locality pay areas, making federal employment in these metros especially competitive with private-sector alternatives.
To put this in role-specific terms, federal budget analysts typically enter around GS-9 or GS-11 and progress to GS-12 or GS-13 within several years. Management analysts follow a comparable trajectory. Urban and regional planners in federal agencies, while less common than at the local level, also benefit from these pay scales when positions are available in agencies like the Department of Housing and Urban Development or the Department of Transportation.
State and Local Government: Lower Base, Closer to Home
State government salaries for the same roles generally trail federal pay by 20 to 30 percent, and local government pay tends to fall somewhere between the two, varying considerably by jurisdiction size and cost of living. A state-level budget analyst might earn in the mid-$50,000s to low-$70,000s depending on the state, while a local government management analyst in a mid-size city could land in the $55,000 to $75,000 range.
Urban planners are a notable exception to the federal dominance pattern, since the majority of planning jobs exist at the city and county level. Local planners typically earn $55,000 to $80,000, with senior planners in large or high-cost jurisdictions pushing above $90,000. The trade-off for lower pay often includes shorter commutes, community-level impact, and, in some states, generous pension systems that close part of the salary gap over a full career.
Nonprofit Sector: Mission Over Money
Nonprofit organizations working in policy advocacy, community development, and social services tend to pay 10 to 20 percent below government for similar roles. A policy analyst at a think tank or advocacy organization might earn $50,000 to $65,000 at the early-career stage, compared to $60,000 to $80,000 for a federal counterpart.
That said, nonprofits offer advantages that do not show up on a pay stub. Professionals often gain broader responsibilities earlier, move into leadership positions faster, and enjoy greater flexibility in choosing the issues they work on. For people driven by a particular cause, whether housing equity, climate resilience, or public health, nonprofit work can provide a sense of mission alignment that is harder to find in a large bureaucracy.
Private Sector: Highest Ceiling, Different Trade-Offs
Private-sector policy roles represent the highest-paying lane in this field. Consulting firms, government contractors, and lobbying or advocacy shops routinely offer salaries 30 to 50 percent above federal equivalents for experienced professionals. A management consultant with public-sector expertise at a major firm can earn well into six figures within a few years of completing a graduate degree.
The caveats are real, though. Private-sector roles often come with less job security, fewer retirement benefits, and reduced access to programs like Public Service Loan Forgiveness. Benefits packages at consulting firms may look generous on paper, but they rarely match the long-term financial value of a federal pension combined with a Thrift Savings Plan. For professionals weighing these options, the total compensation picture, not just the salary line, deserves careful attention.
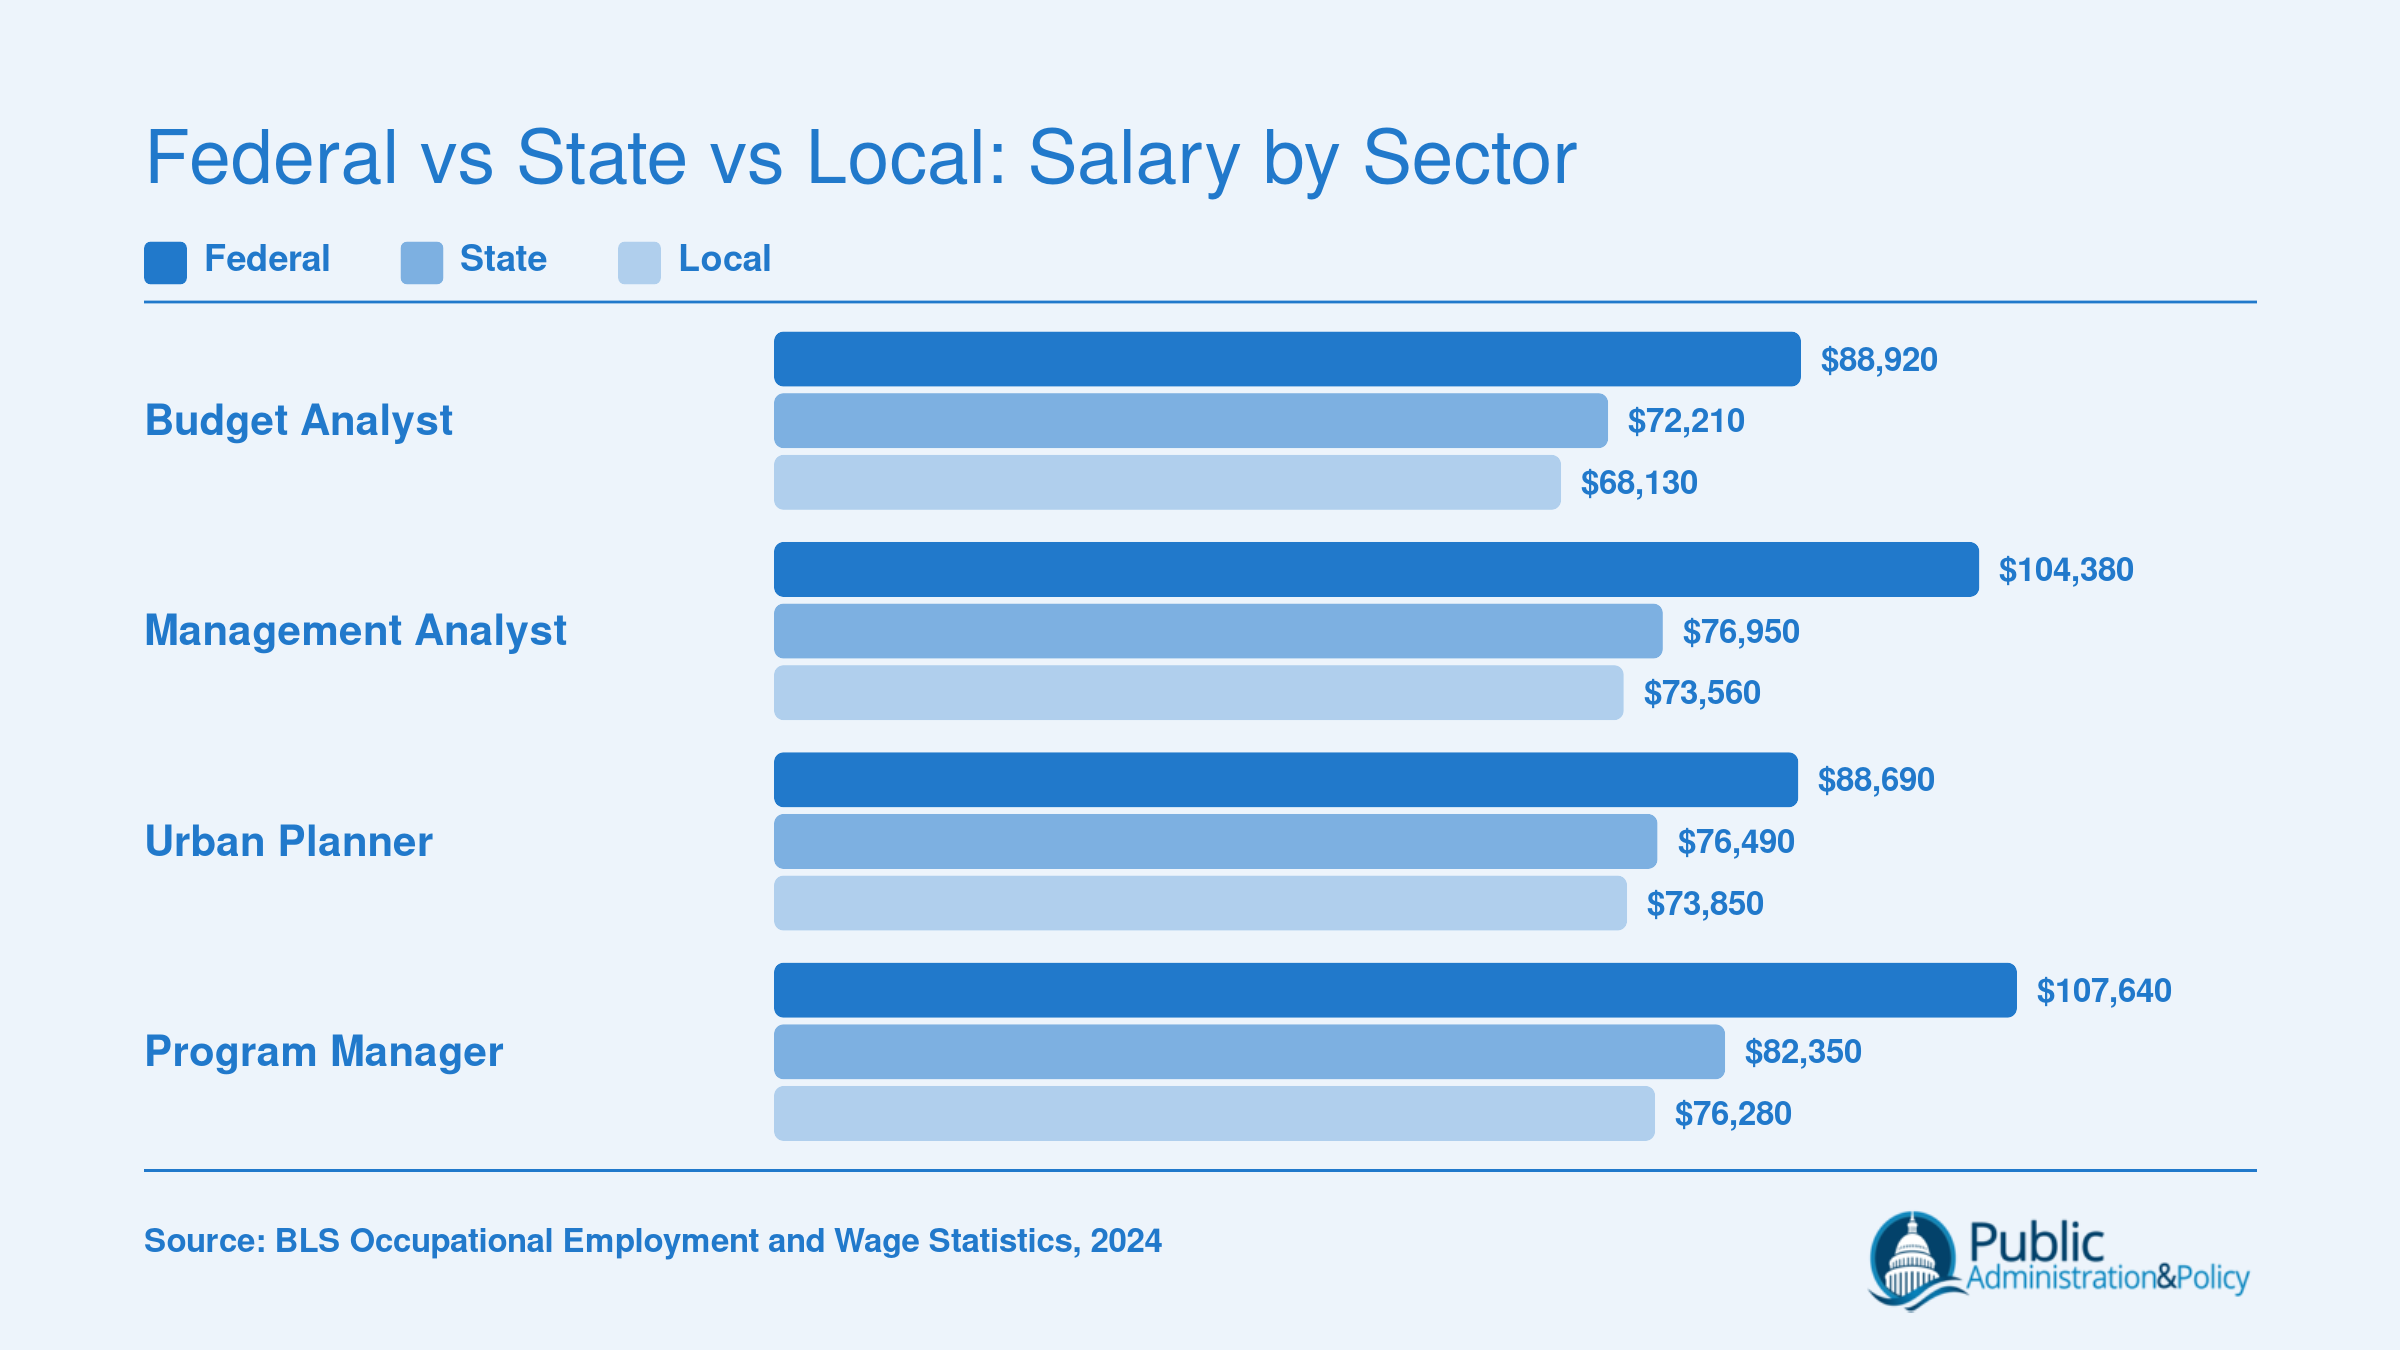
Federal vs State vs Local: Salary by Sector
The sector you work in can mean a difference of $10,000 to $30,000 or more in annual pay for the same type of role. This chart compares median salaries for four common public administration positions across federal, state, and local government levels, making the federal pay premium immediately visible.
Public Administration Salaries by State and Region
Salaries in public administration vary significantly by geography. Coastal states and those near the Washington, D.C. corridor consistently top the list, but raw salary figures only tell part of the story. When you factor in cost of living using tools like the Bureau of Economic Analysis (BEA) regional price parities, states like Virginia, Texas, and Colorado offer notably strong purchasing power relative to their median pay. The table below presents the top 15 highest-paying states for management analysts and social and community service managers, two roles representative of public administration careers, grouped by region.
State
Region
Median Annual Salary
Total Employment
Cost-of-Living Note
District of Columbia
Northeast / Capital Region
$110,190
12,400
Very high cost of living significantly offsets top-tier salary
New York
Northeast
$104,280
48,600
High cost of living, especially in the New York City metro area
New Jersey
Northeast
$101,540
22,100
Above-average cost of living, particularly in northern counties
Massachusetts
Northeast
$99,870
19,700
High cost of living concentrated in the Greater Boston area
Connecticut
Northeast
$97,650
9,800
Above-average cost of living, though lower than neighboring New York
California
West Coast
$102,350
61,200
Very high cost of living statewide, especially in coastal metros
Washington
West Coast
$98,470
18,300
High cost of living in the Seattle metro; more moderate elsewhere
Virginia
South / Capital Region
$97,120
34,500
Moderate cost of living relative to salary, especially outside Northern Virginia. One of the best value states for public admin professionals.
Maryland
Northeast / Capital Region
$95,880
16,200
Above-average cost of living, though lower than D.C. proper
Colorado
Mountain West
$93,740
15,600
Moderate to above-average cost of living; strong purchasing power outside Denver metro. A standout value state.
Illinois
Midwest
$90,120
24,300
Moderate cost of living outside Chicago; solid purchasing power statewide
Texas
South
$88,950
52,800
Below-average cost of living in most metros. Among the best states for salary relative to expenses.
Minnesota
Midwest
$88,410
14,200
Moderate cost of living; competitive salary stretches further than in coastal states
Pennsylvania
Northeast
$86,270
26,400
Below-average to moderate cost of living outside Philadelphia and Pittsburgh
Georgia
South
$84,560
20,100
Below-average cost of living statewide; Atlanta metro offers both strong pay and reasonable expenses
Questions to Ask Yourself
Would you accept a $15K pay cut today in exchange for a pension that replaces 60 to 80 percent of your salary in retirement?
Government pensions can deliver lifetime income that most private sector 401(k) plans struggle to match. A lower salary now may translate into significantly more total compensation over a 30 year career and decades of retirement.
Does location flexibility or remote work access matter more to you than maximizing salary in a high cost metro?
A $95,000 salary in Washington, D.C. may leave you with less disposable income than $75,000 in a mid size city with remote work options. Factor in cost of living and commuting time before chasing the highest posted number.
Are you optimizing for peak earning potential or for career stability and work life balance over a full career?
Private sector consulting roles often pay more at the top, but public sector careers offer predictable advancement, generous leave policies, and lower rates of involuntary job loss. Decide which trajectory aligns with the life you want at 35, 50, and 65.
Career-Stage Salary Progression: Entry-Level to Executive
Understanding how your salary will grow over a 20-plus-year career helps you set realistic expectations and make smarter decisions about specialization, sector, and education. Public administration and policy careers follow a fairly predictable ladder, though the speed of your climb depends on where you work, what you specialize in, and which credentials you hold.
Year 0 to 3: Entry-Level Analyst
Most graduates enter the field as policy analysts, program coordinators, or budget analysts, earning between $45,000 and $60,000. In the federal system, entry-level hires with a master's degree typically start at GS-9, while those with a bachelor's degree often begin at GS-7. Within-grade step increases happen automatically each year, but moving from analyst to senior analyst usually takes two to three years and may require demonstrating subject-matter expertise or completing a competitive promotion process.
At the state and local level, starting pay varies widely by geography, but the trajectory is similar: expect incremental raises and a promotion to a senior individual-contributor role within your first few years.
Year 3 to 7: Mid-Career Manager
By the five-to-seven-year mark, many professionals have moved into supervisory or program management positions, with salaries ranging from $65,000 to $90,000. Federal employees in this band are commonly at GS-12 or GS-13, grades that most dedicated professionals reach within three to five years of their start date. At this stage, your earning power depends heavily on your willingness to take on budget oversight, staff supervision, or cross-agency coordination.
Nonprofit professionals should note that this transition can take longer. Flatter organizational hierarchies mean fewer management titles and slower salary jumps, though mission-driven work and schedule flexibility often offset the gap. Private-sector policy consultants, by contrast, may see steeper early growth, sometimes reaching the $90,000 range within four to five years, though higher billable-hour expectations and burnout risk come with that pace.
Year 7 to 15: Senior Director
Senior directors, division chiefs, and deputy commissioners generally earn $90,000 to $120,000. In the federal General Schedule, this corresponds to GS-14 or GS-15, grades that typically require ten or more years of progressively responsible experience. Reaching this tier faster is possible if you specialize in a high-demand area. Health policy professionals, data analytics leads, and cybersecurity policy experts often advance to higher pay bands more quickly than those in generalist administrative roles, simply because agencies compete harder for those skill sets.
Year 15 and Beyond: Agency Head or Executive
At the top of the ladder sit agency heads, city managers, chief operating officers, and members of the federal Senior Executive Service (SES). Salaries here range from roughly $120,000 to $180,000 or more, with SES members earning above the GS-15 cap. Reaching this level almost always requires a combination of deep specialization, demonstrated leadership, and often an advanced degree such as an MPA, MPP, or PhD.
Key Factors That Shape Your Trajectory
Specialization: Roles in health policy, data analytics, and financial management consistently reach upper pay bands faster than generalist positions.
Sector choice: Private consulting offers the steepest early salary curve but plateaus differently than government service, which rewards longevity through structured step increases and pension accrual.
Education timing: Earning a master's degree before entering the federal workforce can place you one to two GS grades higher at the start, compressing your timeline to mid-career pay by several years.
Geographic mobility: Willingness to relocate for promotions, especially to Washington, D.C., or major state capitals, opens doors to senior roles that may not exist in smaller offices.
Mapping these milestones against your personal goals lets you plan strategically. A 20-year federal career with steady promotions can deliver lifetime earnings that rival or exceed many private-sector paths, especially once you factor in pensions, benefits, and loan forgiveness programs discussed elsewhere in this guide.
Total Compensation: Benefits, Pensions & Loan Forgiveness
When comparing public-sector and private-sector pay, most people focus on base salary alone. That comparison misses the full picture. Once you account for health insurance subsidies, defined-benefit pensions, retirement matching, generous leave policies, and student loan forgiveness, total public-sector compensation often closes the gap with private-sector salaries and, in many cases, exceeds them. This is arguably the most undercovered dimension of the public administration salary conversation.
Federal Benefits: A Package Worth Thousands
Federal employees receive a benefits package that adds substantial value on top of their General Schedule or Senior Executive Service salary. Here are the core components:
Health insurance (FEHB): The federal government covers roughly 72 to 75 percent of the health insurance premium, significantly reducing out-of-pocket costs for employees and their families.
FERS pension: The Federal Employees Retirement System provides a defined-benefit annuity calculated at 1 percent (or 1.1 percent for those retiring at age 62 or later with 20-plus years of service) of your highest three consecutive years of salary for each year of service. A 30-year career at a high-3 average of $95,000 would yield an annual pension of roughly $28,500 to $31,350.
Thrift Savings Plan (TSP): The government matches employee contributions up to 5 percent of salary, including an automatic 1 percent contribution even if the employee contributes nothing. This is comparable to a strong 401(k) match in the private sector.
Paid leave: Federal employees earn 13 to 26 days of annual leave per year depending on length of service, plus 13 days of sick leave, plus 11 paid federal holidays.
Taken together, these benefits can add $25,000 to $35,000 in annual value to a federal employee's compensation, depending on the position and family situation.
Public Service Loan Forgiveness
For professionals carrying federal student loan debt, Public Service Loan Forgiveness (PSLF) is one of the most consequential financial benefits available. After making 120 qualifying monthly payments (roughly 10 years) while working full-time for a qualifying government or nonprofit employer, the remaining federal student loan balance is forgiven entirely. Recent data from the Department of Education indicates that the average forgiveness amount has ranged from approximately $70,000 to $100,000 per borrower. For graduates of MPA or MPP programs, who may carry $40,000 to $80,000 or more in graduate debt, PSLF can effectively function as a major salary supplement spread across the first decade of a career.
State and Local Government Pensions
State and local employers frequently offer defined-benefit pension plans, a retirement structure that has all but disappeared in the private sector. Many of these plans replace 50 to 80 percent of a retiree's final average salary after 25 to 30 years of service. A public administrator retiring as a city manager with a final salary of $110,000 after 30 years could receive $55,000 to $88,000 annually for life, often with cost-of-living adjustments. This kind of guaranteed retirement income is nearly impossible to replicate with a self-directed 401(k), and it represents an enormous long-term financial advantage.
Putting a Dollar Value on Total Compensation
Consider a government employee earning a base salary of $80,000. Once you add the employer's share of health premiums, pension accrual, TSP matching, the monetary value of paid leave, and potential loan forgiveness savings amortized over the career, total compensation may be equivalent to a private-sector salary of $105,000 to $115,000. For employees who remain in service long enough to collect a full pension, the lifetime financial advantage can be even more pronounced.
If you are weighing a public administration or policy career against a higher-paying private-sector offer, resist the temptation to compare base salaries in isolation. The full compensation picture, especially retirement security and debt forgiveness, frequently tips the balance toward public service in ways that a pay stub alone will never show.
A federal employee earning $80,000 with a full FERS pension, TSP match, FEHB health coverage, and Public Service Loan Forgiveness eligibility may hold total compensation equivalent to $110,000 or more in the private sector. Before you compare offers across sectors, factor in retirement contributions, subsidized insurance premiums, and student loan benefits so you are evaluating the full picture.
Job Outlook & Salary Trends Through 2034
Public administration and policy careers benefit from something most industries cannot offer: structural, recession-resistant demand. Government services do not disappear during downturns, and the professionals who manage budgets, analyze policy, and coordinate community programs remain essential regardless of the economic cycle. Here is what the employment landscape looks like heading into the next decade.
Projected Growth for Key Occupations
The Bureau of Labor Statistics projects solid growth across several occupations central to careers in public administration:
Management analysts: Roughly 10 to 11 percent growth through 2033, faster than the average for all occupations, driven by agencies seeking efficiency improvements and data-informed decision-making.
Urban and regional planners: Steady demand as municipalities grapple with housing, climate adaptation, and infrastructure modernization.
Budget analysts: Consistent need at every level of government, with openings tied closely to retirements and agency restructuring.
Social and community service managers: Above-average growth fueled by expanding public health initiatives and social services programs.
Within these categories, certain specializations are accelerating even faster. Roles centered on data-driven policy analysis, emergency management, and health policy are seeing particularly strong demand as governments invest in preparedness, analytics capacity, and post-pandemic public health infrastructure.
The Federal Retirement Wave
One of the most significant workforce dynamics in public administration is generational turnover. A substantial share of the federal workforce, particularly employees in GS-13 through GS-15 positions, is approaching retirement eligibility. The Office of Personnel Management has flagged this trend for years, and its effects are now becoming tangible. As senior professionals exit, agencies will need to backfill leadership roles at an accelerated pace, a dynamic closely tied to broader civil service reform efforts. For mid-career professionals and ambitious early-career employees, this retirement wave translates into faster promotion timelines and greater access to senior positions than previous generations experienced.
Salary Trend Lines
Government pay raises have averaged roughly 2 to 5 percent annually in recent years through General Schedule adjustments and locality pay updates. These increases have generally tracked inflation, though they have occasionally lagged slightly behind private-sector wage growth. The gap tends to narrow when you factor in the full compensation package (pensions, health insurance, and leave policies), but base salary growth in the public sector remains incremental rather than dramatic.
A Reliable Long-Term Bet
Public administration is not a boom-and-bust field. You will not see the explosive salary spikes that tech or finance occasionally produce, but you also will not face the layoffs and instability those sectors experience during corrections. Steady demand for government services, combined with predictable structural turnover from retirements, creates a career path with unusual stability. For professionals who value long-term security alongside meaningful work, the outlook through 2034 and beyond is genuinely encouraging.
Common Questions About Public Administration & Policy Salaries
Salary is one of the most common concerns for students and professionals considering a career in public administration or policy. Below, we answer the questions we hear most often, drawing on current federal data and industry benchmarks to give you a realistic picture of what to expect in 2026.
How much do public administrators make?
Public administrators earn a wide range depending on role, experience, and sector. Entry-level positions typically start in the $45,000 to $55,000 range, while mid-career professionals often earn between $70,000 and $95,000. Senior administrators and agency directors can surpass $130,000 annually, particularly at the federal level. The median for management analysts in government settings sits near $99,000 as of recent Bureau of Labor Statistics reporting.
What is the average salary for public policy jobs?
The average salary for public policy roles varies by specialization, but policy analysts typically earn between $65,000 and $85,000 at the mid-career stage. Senior policy advisors and directors at federal agencies or large nonprofits can earn $110,000 or more. Roles in health policy, economic policy, and regulatory affairs tend to command salaries at the higher end of this spectrum.
Is a master's in public administration worth it salary-wise?
In most cases, yes. MPA holders earn roughly 20% to 30% more over their careers than peers with only a bachelor's degree. The degree also opens doors to senior management and director-level roles that are often inaccessible without a graduate credential. Federal GS pay scales, for instance, generally place master's holders at GS-9 or above upon entry, translating to starting salaries near $60,000 to $70,000 depending on locality.
What is the highest paying job in public administration?
City managers, agency directors, and senior executive service (SES) members in the federal government represent some of the highest-paid roles. City managers in large metro areas can earn $200,000 or more, while SES positions pay between approximately $147,000 and $221,900 in 2026. Outside government, chief operating officers at major nonprofits and consultants advising public sector clients also command top-tier compensation.
How does an MPA salary compare to an MBA salary?
MBA graduates in the private sector often out-earn MPA graduates in raw salary, with median starting pay around $80,000 to $115,000 depending on the program. MPA starting salaries typically fall between $55,000 and $75,000. However, when you factor in government benefits like pensions, generous health coverage, student loan forgiveness through PSLF, and work-life balance, the total compensation gap narrows considerably over a full career.
Do public administration salaries vary significantly by state?
Yes, geography is one of the biggest salary drivers. States with high costs of living, such as California, New York, and Washington, D.C., offer substantially higher pay. Federal employees also receive locality pay adjustments that can add 15% to 35% on top of base salary. Conversely, positions in lower-cost states may pay less in nominal terms but can offer comparable or even superior purchasing power.
What public policy specialization pays the most?
Health policy, economic and fiscal policy, and data analytics within policy research tend to offer the highest salaries. Health policy analysts working at federal agencies or large consulting firms frequently earn $90,000 to $120,000 at mid-career. Specialists in quantitative policy analysis and program evaluation are also in high demand, commanding premium salaries because of their technical skill sets and the growing emphasis on evidence-based policymaking.
Raw salary tells only part of the story. As the sections above make clear, a federal employee earning $80,000 can reach an effective compensation of $110,000 or more once you factor in a FERS pension, TSP match, FEHB coverage, and Public Service Loan Forgiveness eligibility. Add recession-resistant job security and generous leave, and the gap with private-sector offers narrows faster than most people expect.
The decision framework is straightforward. If maximizing lifetime earnings is your top priority, an MBA or a private-sector consulting path will usually win on base pay. If you want mission-driven work paired with strong total compensation and long-term stability, an MPA or MPP into government is a genuinely smart play. Your next step: research specific roles and agencies that match your interests, compare online MPP programs side by side, and run the numbers for your target location's cost of living.