Public Administration Jobs See Pay Raises: What the Data Shows

New York Fed data reveals public administration as one of the few sectors with persistent wage growth — here's what it means for your career.

By Max SheltonReviewed by PAP Editoral TeamUpdated June 24, 202621 min read

What you’ll learn in this article…

  • Public administration is one of only two sectors with above-trend wage growth since late 2022, according to the New York Fed.
  • Federal civilian employees receive about 40% of total compensation in benefits, far exceeding the private sector share.
  • Federal GS employees see scheduled step increases and annual base pay adjustments, building consistent earnings growth over time.

While private-sector wage growth has decelerated across most U.S. industries since late 2022, public administration pay has moved in the opposite direction. New York Fed economists report that the sector is one of only two, alongside mining and construction, to sustain above-trend wage increases during a period of broad cooling in labor costs.

The divergence reorders career calculations for public-sector professionals. Agencies are leveraging pay raises to recruit and retain talent, turning annual step increases, locality adjustments, and cost-of-living allowances into strategic levers rather than routine increments. For the roughly 7 million state and local government employees whose livelihoods depend on these budgets, the trend signals a period of competitive compensation. Those weighing careers in public administration will want to understand where salaries are climbing fastest and what forces are driving the shift.

New York Fed Data: Public Administration Wages Buck the National Trend

The latest analysis from the Federal Reserve Bank of New York reveals a striking divergence in wage growth: while pay increases have been slowing across most U.S. industries since late 2022, public administration has emerged as one of only two sectors where wages are still climbing at a notably faster pace.1 Economists Martín Almuzara, Richard Audoly, and Davide Melcangi published their findings in a Liberty Street Economics post and an accompanying staff report on May 26, 2026, and the story was covered by Fortune's Eleanor Pringle the following day.

A Persistent Outlier in a Cooling Labor Market

Using a trend wage inflation measure derived from Current Population Survey microdata, the New York Fed team found that the typical 12-month change in individual hourly wages has been trending downward for most workers since October 2022.2 However, public administration has consistently bucked that pattern. The report's visual evidence (detailed chart series are available in the original research) shows that while the common component of wage growth has decelerated, the public administration sector retains a strong idiosyncratic component, suggesting sector-specific forces are keeping wages elevated.1

What This Means for Public Administration Careers

For professionals and students considering public administration jobs, the New York Fed data signals a historically unusual labor market. Government employers are raising wages to attract and retain talent precisely at a time when private-sector wage growth is cooling. This inversion can make public sector jobs relatively more competitive on pay during the current cycle. The dynamic is especially important for those weighing an MPA or MPP degree, as it indicates that public administration roles may offer stronger near-term salary gains than many private industries.

One Other Sector Shares the Spotlight

The analysis identifies only one other industry, mining and construction, with similarly persistent wage strength.1 The researchers hypothesize that demand linked to AI data center construction may be fueling that sector's climb. But for this audience, the takeaway is that public administration stands apart for different reasons: budgetary processes, collective bargaining agreements, and delayed labor market responses often cause public sector wages to lag the broader economy on the way down, just as they did on the way up during the pandemic recovery.

Uncertainty Ahead: Cautions from the Report

The New York Fed authors emphasize that "considerable uncertainty remains" about the path of wage inflation.1 They caution that if broader labor market conditions deteriorate, even the currently resilient public administration sector could face downward pressure on wage growth. For current and aspiring public administrators, this underscores the need to monitor not just federal pay adjustments but also state and local fiscal conditions.

Budget Pressures and Policy Implications

Sustained wage growth in public administration will inevitably pressure state and local budgets. Governments may need to make difficult trade-offs between compensation, service levels, and headcount. For public policy and administration salary benchmarking and workforce planning, the current trend raises questions about long-term pay equity, workforce retention strategies, and the fiscal sustainability of rising personnel costs. Those entering the field in 2026 are stepping into a landscape where their compensation is increasingly a live policy debate.

How Much Do Public Administrators Make in 2026?

To find the most current salary data for specific public administration roles, start with the Bureau of Labor Statistics (BLS) Occupational Employment Statistics (OES) by filtering for government sector employers and searching occupations like “Administrators in Public Administration” (SOC 11-3013). For year-over-year trend analysis, consult the BLS Current Population Survey (CPS) Annual Social and Economic Supplement tables under median earnings by industry. Professional associations such as ICMA and ASPA publish detailed compensation reports by region and population size, while state labor departments often provide localized estimates. The following table offers broad national benchmarks to anchor your search.

MetricValueNotes
Median Weekly Earnings, All Full-Time Workers$1,235 (Q1 2026)Annualized: approximately $64,220; Source: Federal Reserve Bank of St. Louis (FRED)
Real Wage Growth, All U.S. Workers6% (2019–2024)Adjusted for inflation; Source: Economic Policy Institute
Typical Salary Range, Public Policy & Social Services Fields$55,000–$70,000Based on field of bachelor's degree; Source: U.S. Bureau of Labor Statistics

Year-Over-Year Wage Growth in Public Administration (2019–2025)

While year-over-year wage growth rates for public administration are not published as a single national series, the Federal Reserve Bank of New York’s wage inflation tracker shows a distinctive pattern. Public administration is one of only two sectors where wage growth has remained persistently strong since October 2022, even as most private industries cooled. This separation points to sustained upward pressure on government compensation, with implications for state and local budgets and workforce recruitment.

Public administration is one of two sectors with persistent wage growth, per New York Fed data from 2022 to 2025.

Public Administration Salaries by State: Where Pay Is Rising Fastest

Although state-level wage growth data for public administration is not yet available, current salary levels offer insight into where compensation is most competitive. The table below shows median annual wages for legislators in the states with the highest reported pay, based on May 2024 occupational employment and wage estimates from the U.S. Bureau of Labor Statistics.

StateTotal EmploymentMedian Annual Salary25th Percentile75th PercentileMean Annual Salary
New York1,44097,05050,810141,990120,330
Hawaii12074,15072,34078,13075,250
Michigan41073,11040,18098,74078,680
Colorado53066,70032,840107,01077,440
Wisconsin96058,85031,60092,03070,890
Delaware9058,25054,06066,52067,620
Maryland50054,43047,89080,53069,530
California2,47054,29035,93094,63079,650
Pennsylvania77051,49022,86092,91070,910
Montana44050,71022,17075,86061,870
Utah30050,60030,63070,62057,320
New Jersey42048,05031,47088,09072,500
Oklahoma37047,49047,49059,85054,790

Top-Paying Metro Areas for Public Administration Roles

Public administration leadership roles command some of the highest salaries in major metros. The table below highlights top-paying areas for chief executives and legislators, using the latest available median wage data from the Bureau of Labor Statistics.

Metro AreaRoleEmploymentMedian Annual Wage
Los Angeles-Long Beach-Anaheim, CAChief Executives12,420$231,500
Minneapolis-St. Paul-Bloomington, MN-WIChief Executives4,590$210,000
Sacramento-Roseville-Folsom, CAChief Executives3,710$159,800
Albany-Schenectady-Troy, NYLegislators370$141,990
Seattle-Tacoma-Bellevue, WALegislators340$125,960
Sacramento-Roseville-Folsom, CALegislators300$110,350
New York-Newark-Jersey City, NY-NJLegislators520$81,240
Cleveland, OHLegislators330$51,970

How Government Pay Raises Work: GS Scale, Step Increases, and COLA

When choosing a career in public administration, compensation isn't just about the headline salary number. Federal employment offers a structured, transparent pay system that balances predictability with geographic adjustments and annual increases. Understanding how raises work under the General Schedule (GS) can help you map out long-term earning potential and compare it to private-sector roles.

The General Schedule (GS) Grade and Step System

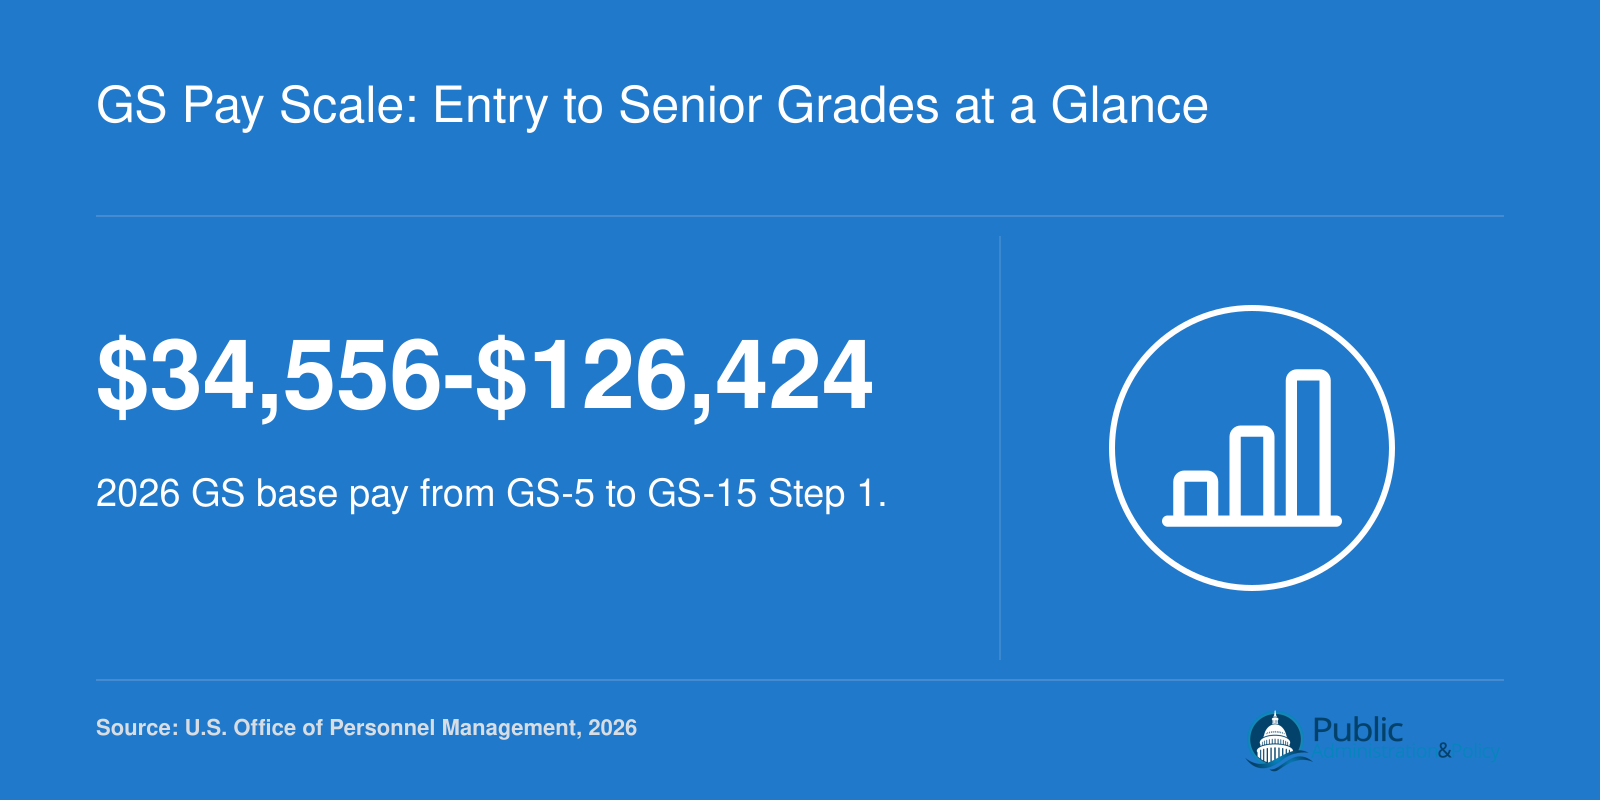
The GS system classifies civilian white-collar federal jobs into 15 grades, from GS-1 to GS-15, based on the role's complexity, responsibilities, and required qualifications. Each grade has 10 steps. New hires typically start at step 1, and they advance to higher steps based on time in service and performance. While the exact dollar amounts vary each year, steps within a grade represent a fixed percentage increase, so moving from step 1 to step 10 can boost your base salary noticeably without changing grades.

Promotion to a higher grade usually requires moving into a position with greater duties, often through competitive selection or career ladder positions. For example, many entry-level professional roles are classified at GS-9 or GS-11, with promotion potential to GS-12 or GS-13 over several years. This progression forms a predictable earnings trajectory that many candidates find attractive. Broader civil service reform efforts at the federal and state level can reshape how these grades and promotion pathways are structured over time.

Locality Pay: Adjusting for Geography

Base GS pay is just the starting point. On top of that, the federal government adds locality pay, which is an additional percentage based on where you work. The Office of Personnel Management (OPM) publishes locality pay tables that reflect regional labor market costs. Metropolitan areas with high costs of living, such as Washington, D.C., San Francisco, and New York City, receive some of the largest locality adjustments. These percentages can significantly raise total compensation, making a GS position in a high-cost area more competitive with local private-sector salaries.

Locality pay rates are updated annually. If you move to a different region for a federal job, your locality rate changes accordingly, so your take-home pay can shift even if your grade and step remain the same.

Annual Federal Pay Raises: The Political Process

Each year, the federal government can implement a pay raise that includes an across-the-board base increase and, often, a separate adjustment to locality pay. The process starts with the president's budget proposal, which includes an alternative pay plan for civilian employees. Congress can accept, modify, or override that plan. Because the pay raise must be enacted through legislation or executive action, it is subject to political negotiations and fiscal priorities. Federal news outlets and OPM announcements are the go-to sources for the official percentage each year. Public policy hiring decisions and labor market conditions can influence how aggressively Congress pushes for higher pay adjustments in a given budget cycle.

For many positions, the annual increase applies to both base pay and locality pay, so employees in higher-cost areas may see a larger dollar boost. However, the raise is a fixed percentage across grades and steps, so its impact varies by salary level.

Cost-of-Living Adjustments for Retirees

Separate from active employee pay raises, federal retirees receive a cost-of-living adjustment (COLA) that helps keep their annuities aligned with inflation. The annual COLA for Civil Service Retirement System (CSRS) and Federal Employees Retirement System (FERS) annuitants is tied to the Social Security COLA, which the Bureau of Labor Statistics calculates using the Consumer Price Index for Urban Wage Earners and Clerical Workers (CPI-W). Announcements typically come in October, and the increase takes effect the following January. Understanding this feature is important for long-term financial planning, as it provides a measure of inflation protection that many private-sector pensions lack.

Together, the GS step structure, locality pay, annual adjustments, and retiree COLAs form a compensation framework that rewards tenure and adapts, at least partially, to economic conditions. While specific dollar figures change yearly, the system's mechanics offer a level of transparency and predictability that can be a major asset for those building a career in public administration.

GS Pay Scale: Entry to Senior Grades at a Glance

Federal public administration salaries follow the General Schedule (GS), a 15-grade system that sets base pay according to role complexity and responsibility. The chart below shows the 2026 base salary range for Step 1, from entry-level GS-5 to senior GS-15. Actual pay is often higher: locality adjustments add 15-45% for employees in high-cost metropolitan areas, step increases reward tenure, and special pay rates may apply in hard-to-fill occupations. This progression illustrates why public administration remains attractive even as private-sector wage growth cools.

GS-5 through GS-15 base salary range from $34,556 to $126,424 in 2026, according to OPM.

Questions to Ask Yourself

A GS-12 Step 1 and Step 10 can differ by over $20,000, with raises arriving every one to three years regardless of performance, creating a predictable path to higher pay without needing a promotion.

Step increases reward tenure directly, compounding over a career. While private-sector bumps often depend on promotions or market conditions, federal steps provide automatic wage growth that outpaces inflation in many cases.

Predictable salary growth reduces financial uncertainty, making it easier to budget for major milestones. This stability can be a hedge against private-sector layoffs or stagnant wages during economic downturns.

Even a moderate starting difference can vanish within a few years if private-sector raises fail to materialize. The built-in step schedule ensures consistent increases that may surpass irregular corporate raises over a decade.

Salary Comparison: Entry-Level to Senior Public Administration Roles

A career in public administration unfolds along a predictable but rewarding salary trajectory, from entry-level analyst positions through senior executive leadership. The pay scale reflects increasing responsibility, specialized expertise, and often an advanced degree like the Master of Public Administration (MPA) or Master of Public Policy (MPP). Below we map the typical progression, drawing on federal General Schedule (GS) data and comparable state and local government roles for the 2025, 2026 period.

Entry-Level Roles and the MPA Advantage

New public administration graduates often start as program or budget analysts, where salaries vary significantly by education level. A candidate with a bachelor's degree typically enters at GS-5 or GS-7, while an MPA or MPP can qualify for GS-9, adding roughly $10,000 to $15,000 to the starting salary in Washington, DC.1

  • Management and Program Assistant (GS-7/9): $52,000, $72,0001
  • Program Analyst (GS-7/9): $55,000, $75,0001
  • Budget Analyst (GS-9): $65,000, $80,0001

In mid-cost metropolitan areas, entry-level management analysts can expect $50,000, $68,000.1 The higher starting grade for graduate degree holders accelerates career earnings and access to early-career promotions.

Mid-Career Progression in Federal and Local Government

After three to seven years, professionals move into roles with greater autonomy and supervisory duties. At the GS-11 and GS-12 levels, salaries climb substantially, and the work shifts from execution to analysis and program management. Those interested in specializing further can find detailed career pathways in our guide on becoming a public budget analyst.

  • Program Analyst (GS-11): $75,000, $95,0001
  • Senior Program Analyst (GS-12): $90,000, $115,0001
  • Budget Analyst (GS-12): $95,000, $120,0001
  • Grants Management Specialist (GS-12): $95,000, $120,0001

In mid-cost metros, a Senior Management Analyst earns $75,000, $105,000.1 These figures align with Bureau of Labor Statistics median wages for management analysts and budget analysts, which typically range from $80,000 to $100,000 nationally depending on the specific occupational category and experience level.

Senior Executive Roles: Federal SES and City Management

At the highest tiers, public administration leaders operate as agency directors, deputy directors, or city managers. Federal Senior Executive Service (SES) positions command premium pay, while large-city managers in high-cost metros can surpass even federal compensation.1

  • Supervisory Program Manager (GS-13): $110,000, $135,0001
  • Branch Chief (GS-14): $125,000, $155,0001
  • Deputy Office Director (GS-15): $145,000, $185,0001
  • Office Director (SES): $195,000, $230,0001

For state and local governments, compensation can be equally competitive. A City Manager in a small jurisdiction earns $120,000, $165,000, while those leading large cities command $200,000, $275,000, frequently exceeding SES pay.1 Higher education administrative roles offer another path, with government program manager equivalents in university settings earning $70,000, $110,000 as assistant or associate directors, directors of institutional research at $110,000, $170,000, and deans at $150,000, $240,000.2

This structured progression underscores the value of experience and advanced credentials in public administration.

Public Administration Vs. Private Sector: Compensation Beyond Salary

As government agencies raise pay to compete for talent, the full picture of public sector compensation extends well beyond base salary.

The Benefits Heavyweight

According to the Bureau of Labor Statistics' March 2026 Employer Costs for Employee Compensation data, state and local government workers receive total compensation of $66.41 per hour, compared to $46.60 for private industry employees, a 42.5 percent advantage.1 Wages account for some of that gap ($40.82 versus $32.60), but benefits drive the bulk of the difference: $25.59 per hour for government versus $14.01 for private employers. Benefits represent 38.5 percent of total compensation in the public sector, compared to just 30.1 percent in private industry.

Retirement costs illustrate the disparity vividly. State and local governments spend $5.91 per hour on retirement savings, nearly four times the $1.46 private employers allocate.2 This reflects the prevalence of defined-benefit pensions, which remain uncommon outside government. Beyond retirement, employees in public administration careers typically receive superior health insurance cost-sharing, 13 to 26 days of paid vacation annually, and eligibility for the Public Service Loan Forgiveness program. Layoffs are far less frequent than in the private sector, adding a layer of job security that does not appear in hourly compensation statistics.

The Private Sector's Pay Card

Private industry tends to offer higher base salaries for comparable roles, especially at senior levels. The wage gap between state and local government and private workers is 25.2 percent, but that figure encompasses all occupations; for professionals with advanced degrees, the difference can be more pronounced. Federal workers, according to the Congressional Budget Office, earn just a 2 percent wage premium over comparable private sector employees.3

In the private sector, compensation often includes equity grants, performance bonuses, and profit-sharing plans that can substantially boost take-home pay. Salary negotiation cycles are typically faster, and lateral moves or promotions can unlock larger gains than step-based government pay scales allow.

The Total Compensation Equation

The Congressional Budget Office found that federal workers with a bachelor's degree held a 16 percent total compensation premium over private sector peers, driven by a 48 percent benefits advantage.3 For state and local employees, the difference is even broader, with total compensation exceeding the private sector by more than 40 percent.

Nevertheless, transitioning from private to public employment usually involves a 10 to 20 percent cut in base salary. Yet when the full package of pensions, health benefits, and leave is considered, many professionals discover their total compensation is comparable, or even higher, than what they left behind.

Did you know? Federal civilian employees receive about 40% of their total compensation in the form of benefits, according to the Congressional Budget Office. This significantly exceeds the typical private sector share, making public administration roles more lucrative than base salary alone suggests.

What's Ahead: Public Administration Job Demand and Salary Outlook

Understanding what lies ahead for public administration employment means consulting the right data sources and keeping an ear to the ground for policy shifts. The job market carries both tailwinds and headwinds, depending on specialization, and wise career planning starts with evidence.

Projections from the Bureau of Labor Statistics

The Bureau of Labor Statistics (BLS) Occupational Outlook Handbook offers the most authoritative projections for government-related occupations. For public administration degrees and careers, two key categories to watch are General and Operations Managers (SOC 11-1021) and Legislators (SOC 11-1031). Management occupations nationally are projected to grow faster than the average for all occupations between 2024 and 2034, with about 1.1 million annual openings.1 Their median annual wage in 2024 stood at $122,090, more than double the all-occupations median of $49,500.1 This strong demand suggests that public sector management positions will remain competitive, though not all public administration-aligned fields share the same tailwinds.

Several professions commonly linked to policy and government work face headwinds. Political scientists and administrative law judges are projected to see declining employment through 2034, while economists are expected to grow slower than average.3 In contrast, fields like computer and mathematical occupations (10.1% growth) and healthcare (7.2% growth) offer faster expansion, reflecting broader economic shifts that influence government hiring.2 Readers should check the BLS website directly for the latest projections by SOC code to get a precise view for their target role.

Tracking Federal and State Hiring Activity

Beyond BLS data, real-time hiring trends emerge from agency reports and professional associations. The Office of Management and Budget (OMB) and the Government Accountability Office (GAO) regularly publish workforce analyses. The American Society for Public Administration (ASPA) and the Network of Schools of Public Policy, Affairs, and Administration (NASPAA) provide insights through member surveys and policy briefs. Publications like GovExec.com and Route Fifty track budget proposals, workforce reduction announcements, and federal hiring freezes as they happen.

Monitoring the Office of Personnel Management (OPM) and state-level budget offices is essential to gauge near-term employment shifts. Recent wage growth data from the New York Fed underscores how public administration remains an outlier, which may both reflect and influence staffing levels. Checking these sources quarterly helps public administration professionals anticipate which agencies are expanding.

Where to Find Reliable Salary Data

For salary benchmarks, cross-reference BLS wage estimates with the Occupational Employment Statistics (OES) program and state-specific labor market information sites. The BLS Occupational Outlook Handbook provides median wages for hundreds of occupations, while OES offers granular geographic detail. State labor departments often publish regional adjustments that can highlight where pay is rising fastest. When combined with projections, these data points help professionals explore careers in public policy and negotiate offers and plan career moves within public administration.

Putting the Outlook in Perspective

The overall public administration job market shows mixed signals. On one hand, management occupations are thriving, and public sector employers are raising wages to compete. On the other, certain specialized policy roles may see fewer openings. Total employment in public policy and social services reached 994,200 in 2024, a substantial base that underscores the field's size even as it evolves.4 By staying informed through BLS data and real-time policy news, public administration professionals can navigate a landscape that rewards adaptability and evidence-based career planning.

Frequently Asked Questions About Public Administration Pay

Public administration salaries are shifting as federal data reveals sustained wage growth in government sectors while private industry pay gains cool. These answers address common questions about demand, pay mechanisms, salary levels, and how public sector compensation stacks up in 2026.

Yes, demand remains strong. The New York Fed's latest wage report highlights persistent wage growth in public administration, signaling that government employers are actively competing for talent. Retirements and expanding regulatory needs continue to create openings, particularly in local and state government agencies.

The field is poised for steady growth as governments modernize services and address complex policy challenges. Despite concerns about budget pressures, the New York Fed data shows public administration wage growth bucking the broader slowdown, indicating long-term investment in the workforce and resilience in public sector employment.

Most federal pay increases follow the General Schedule (GS) system, combining annual across-the-board raises, step increases based on tenure and performance, and locality adjustments. In some years, cost of living adjustments (COLA) also apply, while state and local governments often use similar merit and inflation-based structures.

Salaries vary by role and location. As of 2026, typical earnings range from $45,000 for entry-level analysts to over $120,000 for senior program directors. The persistent wage growth noted by the New York Fed suggests these figures are on an upward trajectory, especially in states with high demand for public services.

Public administration base salaries often trail private sector levels for comparable roles, but benefits like pensions, job stability, and health coverage narrow the gap. While private sector wage growth is cooling, the New York Fed found public administration wages still rising, making government roles increasingly competitive on total compensation.

Recent News

Recent Articles