What the May 2026 Jobs Report Means for Public Sector Careers

Breaking down federal, state, and local government hiring trends — and what they signal for public administration professionals.

By Holly AbramsonReviewed by PAP Editoral TeamUpdated June 10, 202624 min read

What you’ll learn in this article…

  • Government accounted for roughly 30% of all nonfarm job gains in May 2026, adding 52,000 positions nationwide.
  • Local governments drove nearly all public sector growth, adding about 55,000 jobs while federal payrolls declined slightly.
  • Private sector average hourly earnings hit $37.53 in May 2026, widening the wage gap that complicates government recruitment.
  • Revelio Labs reported 123,700 total U.S. jobs gained in May, offering policymakers a faster alternative to official BLS data.

Government added 52,000 jobs in May 2026, accounting for roughly 30 percent of the nation's total nonfarm payroll gain of 172,000, even as the national unemployment rate held steady at 4.3 percent. That outsized public sector share stands in sharp contrast to recent years, when government hiring lagged private employment growth.

The concentration underscores a broader shift: local governments, flush with federal infrastructure grants and facing pressure to rebuild post-pandemic service levels, drove nearly all the public sector increase. Federal and state payrolls were essentially flat. For public administrators and policy analysts, the divergence reveals where budget capacity and political will are converging in 2026, and where public budget analyst expertise is increasingly valuable.

This pattern carries immediate implications for wage competition, workforce planning, and the shelf life of pandemic-era labor agreements. Private sector hourly earnings rose 3.4 percent year-over-year, outpacing many state and local pay schedules still locked into pre-inflation frameworks.

May 2026 Jobs Report: Headline Numbers and Public Sector Highlights

Government hiring accounted for a striking share of total job gains in May 2026. Of the 172,000 nonfarm positions added nationally, 52,000 were in government, meaning roughly 30% of all new jobs landed in the public sector. That outsized contribution underscores the continued role of government as a stabilizing force in the labor market. Notably, private-sector analytics firm Revelio Labs reported a lower total of 123,700 jobs gained for the same month, a gap that highlights how different methodologies and data sources can paint meaningfully different pictures of the same economy. For public administration professionals and policy analysts, comparing these estimates is an increasingly important part of real-time labor market assessment.

May 2026 Jobs Report: Headline Numbers and Public Sector Highlights

Federal vs. State vs. Local Government: Where the Jobs Are

The Three-Tiered Public Sector Landscape

The May 2026 employment report reveals a distinctly uneven pattern across the three tiers of American government. While private-sector job growth grabbed headlines, the public sector's internal shifts highlight where taxpayer-funded employment is expanding and where meaningful contractions are underway.

Federal Government: A Flat Month Amid a Steep Annual Decline

Federal employment held essentially steady in May, inching up by just 1,000 to reach 2.677 million.1 This negligible monthly change, however, masks a dramatic over-the-year contraction. Compared to May 2025, the federal workforce has shed 275,000 jobs, a decline of 9.3 percent.1 Personnel reductions, concentrated in administrative and regulatory agencies, have reshaped the federal job market. For public administration professionals, the flat May figure suggests that rapid downsizing may be leveling off, but the cumulative loss of nearly one in ten federal positions over the past year signals a continued period of limited openings and heightened competition. Those interested in understanding the structural changes driving these cuts can review the evolving Schedule Policy/Career federal workforce classification.

State Government: Education Losses Offset by Non-Education Gains

State employment nudged down by 4,000 in May, settling at 5.467 million, but the headline number conceals two opposing currents.1 State education employment fell by 10,800, largely a seasonal adjustment as K-12 schools and public universities reduce staff for the summer break. In contrast, state non-education employment rose by 6,800, with gains in public safety, transportation, and health services. Over the year, the split is even more telling: state education lost 47,900 jobs (-1.8 percent), while non-education payrolls decreased by a mere 100.1 This suggests that while education funding continues to face headwinds, core state functions outside the classroom are holding roughly steady, a signal that state budgets are protecting essential services even as they trim instructional support.

Local Government: The Engine of Public Sector Growth

Local governments powered the public sector in May, adding 55,000 jobs, the strongest monthly advance of any government tier.2 The expansion was broad-based: local education employment climbed 11,000 as districts staffed up for summer programming and facility maintenance, and local non-education positions surged by 44,000, spanning parks, sanitation, law enforcement, and administration.2 Over the year, local government added 149,000 jobs (1.0 percent growth), bringing total local employment to 15.243 million.3 This consistent expansion reflects persistent demand for municipal services, a recovery from pandemic-era staffing shortfalls, and seasonal hiring that peaks in late spring.

Why the Local Surge Matters for Public Administration Careers

The granular breakdown, absent from most top-level summaries, carries direct implications for policy practitioners and job seekers. Federal hiring remains constrained by ongoing restructuring; state roles outside education offer modest stability; but local government stands out as the primary source of new public administration jobs. The 55,000 monthly increase, driven particularly by non-education hiring, points to career openings in urban planning, public works, social services, and emergency management. Aspiring public budget analysts will find growing demand at the municipal level as cities manage expanding payrolls and capital budgets. Policymakers should note that even as federal and state workforces contract or stagnate, cities and counties are quietly driving the government employment engine, a trend likely to influence budget allocations and workforce development strategies through the rest of 2026.

What's Driving Local Government Hiring in 2026?

Federal infrastructure dollars versus expiring pandemic relief: two fundamentally different revenue streams are now shaping local government staffing decisions in 2026. On one side, the Infrastructure Investment and Jobs Act (IIJA) continues to flow substantial grants to municipalities for capital projects and workforce expansion. On the other, the sunset of American Rescue Plan Act (ARPA) funds has forced localities to make hard choices about which positions to backfill with their own tax revenue. Understanding both flows helps explain why local government added jobs in May 2026 while state employment contracted.

Federal Grants Fueling Local Hiring

The IIJA is now in its peak disbursement phase. As of February 2026, nearly 69 percent of the law's $546 billion in enacted budget authority had been obligated, though only 41 percent had translated into actual outlays.1 Highway funding ($350 billion) and transit funding ($90 billion) account for the bulk of these commitments, with additional allocations for electric grid modernization ($73 billion) and climate resilience ($50 billion).2 Local governments competing successfully for these grants are hiring civil engineers, project managers, construction inspectors, and environmental compliance specialists to meet federal reporting and delivery requirements. The Congressional Budget Office projected that outlays would reach 51 percent by the end of fiscal year 2026, meaning dollars are hitting municipal accounts at an accelerating pace.1 These infrastructure hires are multi-year positions tied to project timelines, not one-time staffing bumps. Professionals interested in managing these funding streams may find the grant administrator role especially relevant in the current environment.

The CHIPS and Science Act similarly requires recipients to develop detailed workforce development plans, and many localities are using formula grants to expand community college programs and apprenticeship coordinators within economic development departments. These federally catalyzed hires show up in local government payrolls, even though the ultimate goal is private-sector semiconductor manufacturing.

The ARPA Fiscal Cliff and Own-Source Revenue

ARPA's State and Local Fiscal Recovery Funds, which provided $350 billion in flexible aid during the pandemic, carried spending deadlines through December 2024, with obligation windows closing in 2026. Localities that used ARPA to temporarily expand services or staff now face a binary choice: eliminate those roles or backfill them with property taxes, sales taxes, or utility fees. Jurisdictions with strong tax bases and rising property valuations have opted to retain many positions, particularly in public health and social services. Smaller or economically stagnant communities have been forced to cut. This divergence is creating a two-tiered local government labor market, with suburban and high-growth metros continuing to hire while rural counties freeze vacancies. Research from the Urban Institute confirms that the IIJA promised a fundamental shift in how infrastructure funding reaches communities, yet the unevenness of local fiscal capacity determines whether those promises translate into permanent staffing.3

Education, Public Safety, and Health Lead Functional Growth

Three functional categories dominate local government gains. First, public education remains the single largest driver: K-12 staffing is recovering from pandemic-era turnover, and state education budget cycles approved in mid-2025 are now translating into classroom teacher, counselor, and paraprofessional hires. Second, public safety departments are adding dispatchers, corrections officers, and community outreach staff in response to both rising call volumes and public policy boost hiring strategies that favor civilian crisis response. Third, county and municipal health departments are rebuilding capacity after years of attrition, hiring epidemiologists, nurses, and environmental health inspectors as federal public health grants become available.

Why State Government Employment Declined

In contrast, state government shed approximately 4,000 jobs in May 2026. Budget constraints explain much of the decline: many states operate under balanced-budget requirements and face slower revenue growth as federal pandemic aid tapers. Several large states implemented selective hiring freezes on administrative and back-office roles, preferring to hold vacancies open rather than commit to permanent payroll obligations. Additionally, structural consolidation initiatives, particularly in IT, procurement, and human resources, have reduced headcount through shared-service models and automation. These consolidation efforts reflect broader civil service reform trends that prioritize efficiency over headcount. Unlike localities, which are adding staff to deliver capital projects and direct services, states are trimming middle management and consolidating functions to preserve fiscal flexibility in an uncertain economic environment.

Public vs. Private Sector Wage Growth: May 2026 Comparison

Public sector wage trends in May 2026 remain a critical concern for government employers competing for talent. According to the Bureau of Labor Statistics, average hourly earnings for all private sector workers reached $37.53 in May 2026, reflecting a 3.4% year-over-year increase. Production and nonsupervisory workers in the private sector earned $32.31 per hour, with slightly faster wage growth at 3.6%. While BLS does not publish a directly comparable average hourly earnings figure for government workers in the same release, historical patterns suggest that public sector base wage growth has consistently lagged private sector gains. However, total compensation tells a different story: when factoring in the value of public sector benefits, including defined-benefit pensions, health insurance, and paid leave, government compensation packages often narrow or close the gap with private employers.

Private sector average hourly earnings of $37.53 and $32.31 with 3.4% and 3.6% wage growth in May 2026

Questions to Ask Yourself

A defined-benefit pension, health benefits, and loan forgiveness can substantially offset lower annual wages over a 20-year career.

Pensions often replace 60-80% of final salary, potentially surpassing private sector 401(k) retirement savings when combined with job stability.

Loan forgiveness, employer-covered health premiums, and job security represent hidden compensation that can outweigh a raw wage gap for public service professionals.

Alternative Data Sources: What Revelio Labs' Numbers Tell Us

Revelio Public Labor Statistics is a privately produced labor market report that draws on public professional profiles and job postings, covering more than 100 million U.S. profiles, to estimate national employment changes.1 For May 2026, Revelio reported 123,700 jobs gained across the U.S. economy, a figure that landed noticeably below the Bureau of Labor Statistics' official estimate of 172,000.2 Understanding why those numbers diverge, and what each one offers public sector decision-makers, is increasingly relevant for anyone working in government workforce planning or policy analysis.

Why the Numbers Differ

The gap between 123,700 and 172,000 is not a sign that one source is wrong. It reflects fundamentally different collection methods.

The BLS establishment survey samples roughly 27 percent of total employment through direct payroll data from employers, while its household survey reaches about 0.03 percent of employed individuals through phone and in-person interviews.3 Revelio, by contrast, aggregates digital footprints: professional profiles, job postings, and related online signals covering an estimated 85 percent of U.S. non-farm employment. It then applies statistical modeling, seasonal adjustment, and lag correction to produce nationally representative estimates.1

Because Revelio's underlying data refreshes continuously, the firm releases its jobs figure the day before BLS Jobs Friday and before the Job Openings and Labor Turnover Survey.3 That timing advantage is the core appeal for policy professionals who cannot afford to wait weeks for revised government statistics.

What Public Administrators Gain

For state and local workforce planners, having a credible early signal of labor market direction can sharpen decisions around:

  • Budget forecasting: Faster employment estimates help revenue offices model payroll tax receipts sooner. Professionals in public budget analyst roles stand to benefit directly from this kind of early intelligence.
  • Program staffing: Agencies running employment services or public benefits programs can anticipate caseload shifts before official data confirms them.
  • Sector-level insights: Revelio breaks data down by two-digit occupation and industry codes and by state, letting analysts isolate public sector trends from the broader economy.3
  • Wage intelligence: Because the product tracks advertised salaries on new job openings, hiring managers in government can benchmark compensation against real-time private sector offers.1 For context on current pay scales, our public administration salary guide provides a useful baseline.

As reported through PR Newswire, the May figures are part of Revelio's broader effort to provide a parallel lens on employment that complements, rather than replaces, official statistics.2

Important Limitations

Public administrators should treat Revelio's data as a supplement, not a substitute for BLS releases. Several caveats matter:

  • Revelio is not a government statistical agency and is not subject to the same transparency requirements.
  • Its methodology is proprietary, with no detailed technical papers or independent validation studies publicly available as of 2026.1
  • The product excludes military personnel, interns, the self-employed, proprietors, and workers on leave, which can skew comparisons with BLS totals.1
  • It does not produce an unemployment rate or labor force participation rate, limiting its usefulness for broader macroeconomic assessment.3

The growing availability of alternative labor data is a meaningful development for the public administration field. Agencies that learn to triangulate between official statistics and private analytics will be better positioned to respond to labor market shifts in near-real time. That said, the credibility of any supplemental source depends on how transparently it documents its methods, and on that front, Revelio still has ground to cover.

Career Outlook: In-Demand Public Sector Roles After May 2026

Generalist public administration degrees open many doors, but targeted specializations aligned with current hiring surges can accelerate your path to meaningful work. The May 2026 employment data reveals clear patterns in where government agencies are investing, and understanding these trends helps MPA and MPP students position themselves strategically.

K-12 Educators and School Administrators

The local education hiring surge documented in May 2026 translates directly into demand for classroom teachers, special education specialists, and building-level administrators. School districts across the country continue addressing pandemic-era learning gaps while managing enrollment shifts. For policy students, roles in curriculum coordination, district-level planning, and education policy analysis offer pathways that combine instructional expertise with administrative responsibility. Concentrations in education policy or nonprofit management pair well with state teaching credentials for those seeking leadership positions.

Municipal Infrastructure and Project Management

Federal infrastructure spending under the Infrastructure Investment and Jobs Act continues flowing to state and local governments, creating sustained demand for project managers, civil engineering coordinators, and grants administrators. Cities and counties need professionals who can navigate federal compliance requirements, manage contractor relationships, and deliver capital projects on schedule. Those interested in overseeing large-scale government initiatives should explore federal program management as a career pathway. MPA students should consider concentrations in public finance or urban planning, and certifications such as Project Management Professional credentials strengthen candidacy considerably.

Public Health Analysts

State and local health departments remain in rebuilding mode, staffing up epidemiology teams, community health coordinators, and data analysts who can translate population health metrics into actionable policy recommendations. MPP students with quantitative methods training and coursework in health policy find strong opportunities here. Geographic information systems skills and familiarity with health data platforms add practical value.

Law Enforcement and Corrections

Despite ongoing debates about public safety models, many jurisdictions continue hiring sworn officers, civilian analysts, and corrections staff. Policy analysts who specialize in criminal justice reform or evidence-based policing can find roles in research divisions, inspector general offices, and state-level oversight agencies. Those drawn to bridging research and practice may also consider public policy consulting as an adjacent career track.

Government IT and Cybersecurity

Digital transformation initiatives across all government levels drive demand for cybersecurity specialists, systems administrators, and technology policy advisors. Students interested in this intersection should pursue coursework in digital governance or technology policy alongside technical certifications such as CompTIA Security+ or Certified Information Systems Security Professional credentials.

Regional Variation Matters

Sun Belt metros and fast-growing suburban counties show the strongest local government hiring activity. Texas, Florida, Arizona, and the Southeast corridor consistently post more openings in municipal administration, public works, and school leadership than slower-growth regions. For a broader look at the field, our guide to careers in public administration maps out salary benchmarks and growth projections across specializations. Job seekers willing to relocate to high-growth areas often find shorter search timelines and competitive starting salaries.

As of May 2026, total government employment across federal, state, and local levels sits roughly 232,500 jobs above its pre-COVID peak in February 2020, according to the Bureau of Labor Statistics Current Employment Statistics data. The public sector has not only recovered from pandemic losses but now exceeds that benchmark by a notable margin.

How the May 2026 Data Could Shape Government Policy and Budgets

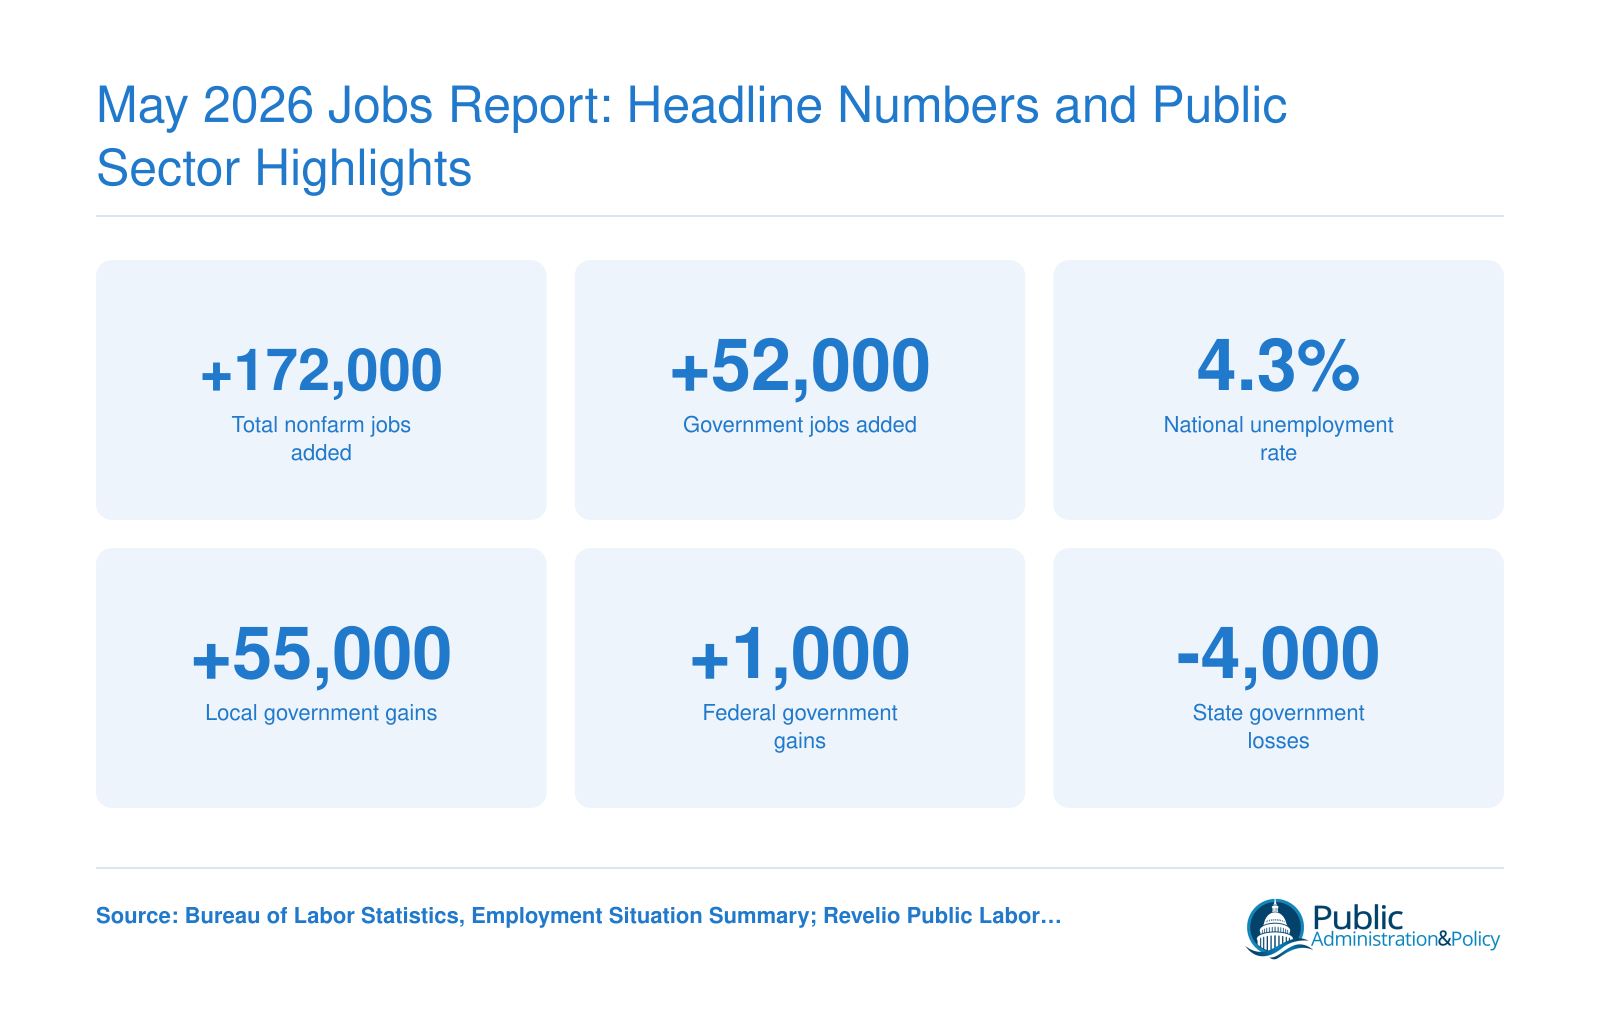
For public-sector budget directors, the 22,000 local government jobs added in May 2026 create a fiscal riddle: robust hiring may signal healthy tax bases and voter appetite for services, yet it also raises red flags about structural deficits if revenues soften. The composition of job gains across government levels and the broader 4.3% unemployment rate will shape not only budget negotiations for FY2027 but also Federal Reserve calculus and agency staffing strategies.

The Local Hiring Surge and Looming FY2027 Budgets

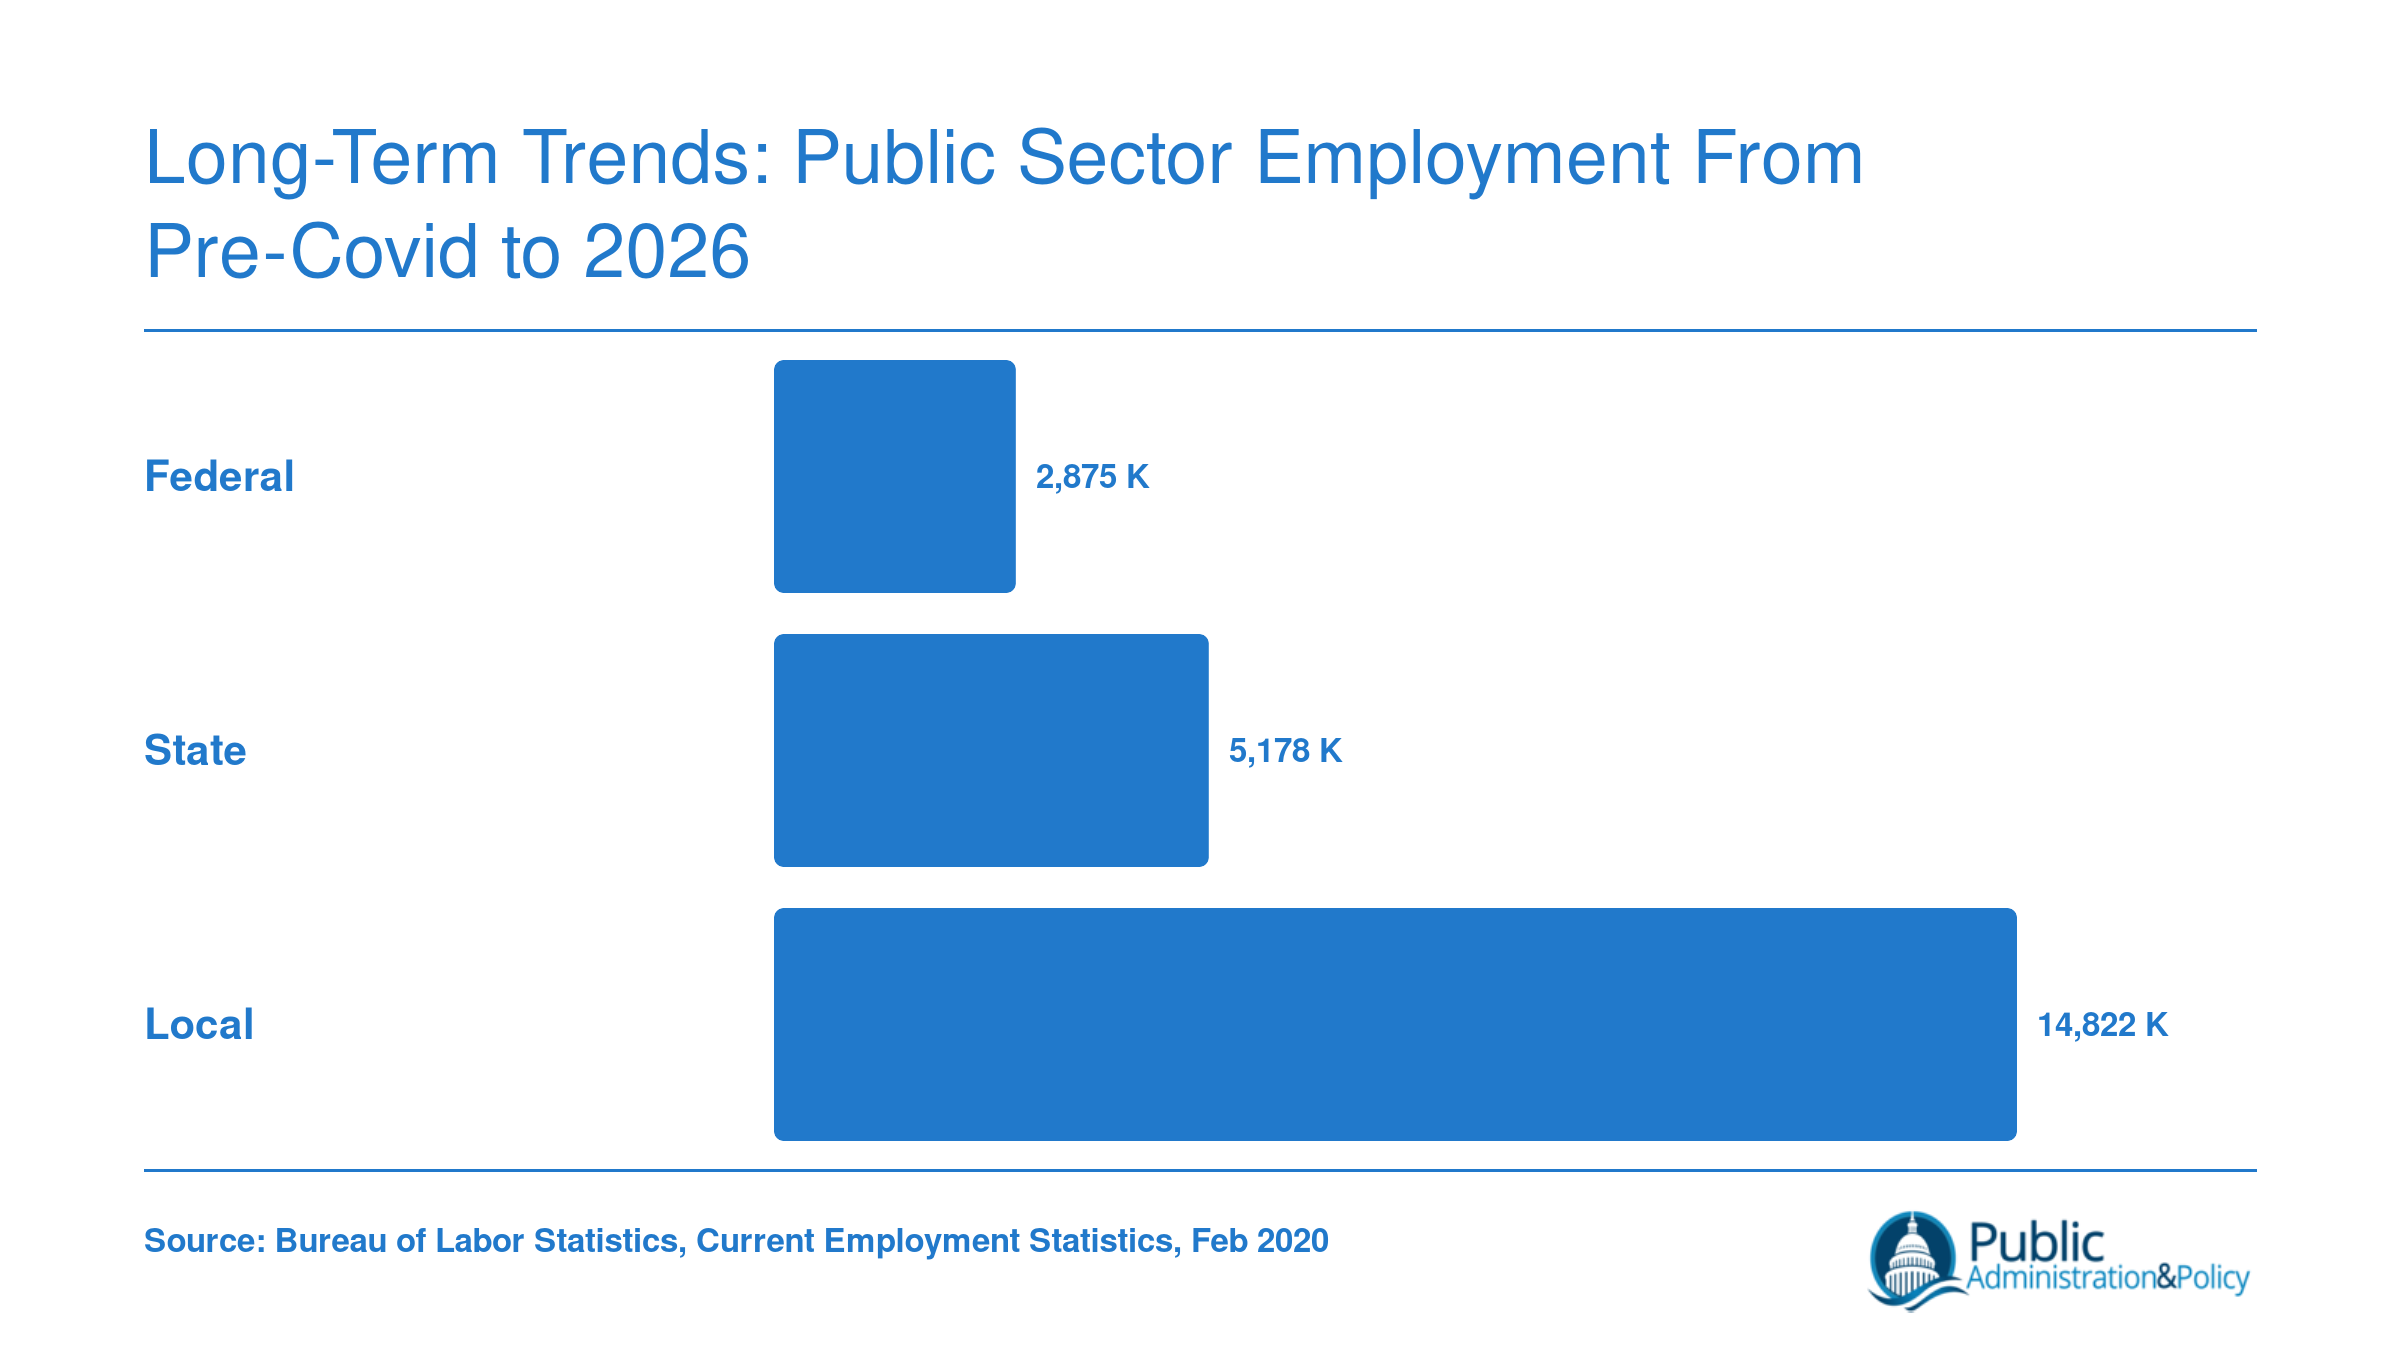
Local government added 22,000 positions in May, accounting for a disproportionate share of the month's public-sector growth. For state and municipal finance officers, these hires sit at the center of FY2027 budget debates. On one hand, headcount growth often reflects expanding service demands: libraries, public works, and public health departments that were stretched thin during the pandemic are finally rebuilding capacity. Sales and property tax receipts have held steady in many regions, giving elected officials the confidence to authorize new positions.

However, personnel costs are the single largest line item in most local budgets. A sudden hiring surge without corresponding permanent revenue increases can create structural deficits when temporary federal aid expires or economic conditions shift. Budget analysts should scrutinize whether these new roles are funded by one-time grants or recurring general fund allocations. The composition of hires matters too: if most additions are in revenue-generating functions like building permits or code enforcement, the fiscal risk is lower than if they concentrate in discretionary social services.

For policymakers, this data point demands a careful balancing act. It validates investments in community infrastructure but also stresses the importance of public policy making before committing to permanent headcount. As unions and public-sector advocates cite the jobs report to push for greater staffing, budget directors will need to temper expectations with realistic revenue projections.

Flat Federal Hiring: Freeze, Restructuring, or Both?

While local governments expanded, federal agencies added only 1,000 jobs in May, a near-zero figure that underscores the ongoing chill on Washington's civilian workforce. This aligns with continued executive branch hiring freezes and agency restructuring efforts that have capped new appointments across many departments. The Department of Veterans Affairs and defense-related civilian roles remain exceptions but do not offset broader attrition.

For MPA and MPP students eyeing federal careers, this signals a more competitive landscape. Vacancy announcements are fewer, and agencies are prioritizing internal candidates or contractors. However, restructuring also creates openings in emerging fields like AI governance, climate resilience, and program evaluation, roles that did not exist five years ago. The flat headline number masks a churn of skills-based realignment.

From a policy perspective, persistent understaffing at agencies like the IRS, State Department, and SSA has long-term consequences for service delivery and regulatory capacity. If the hiring plateau continues into FY2027, policymakers may need to weigh the cost of operational failures against the political desire to shrink government. This tension is likely to surface during upcoming budget authorizations, particularly if backlogs in visa processing or tax refunds become salient.

A 4.3% Unemployment Rate: What It Means for Government Recruitment Competition

With the national unemployment rate holding at 4.3%, the labor market remains tight by historical standards. For public-sector HR managers, this translates into fierce competition with private employers for skilled workers. Government roles have traditionally compensated for lower pay with job security and benefits, but in a 4.3%-unemployment economy, even that advantage erodes.

Applicant pools for mid-level professional positions (budget analysts, urban policy planners, program managers) are shallower than in previous years. Candidates have more options and can command higher salaries outside government. Consequently, public agencies are experiencing longer fill times and may be forced to lower experience requirements or increase starting salaries, straining wage structures and pay equity considerations. For context, our public administration salary guide illustrates how government compensation compares across roles and levels.

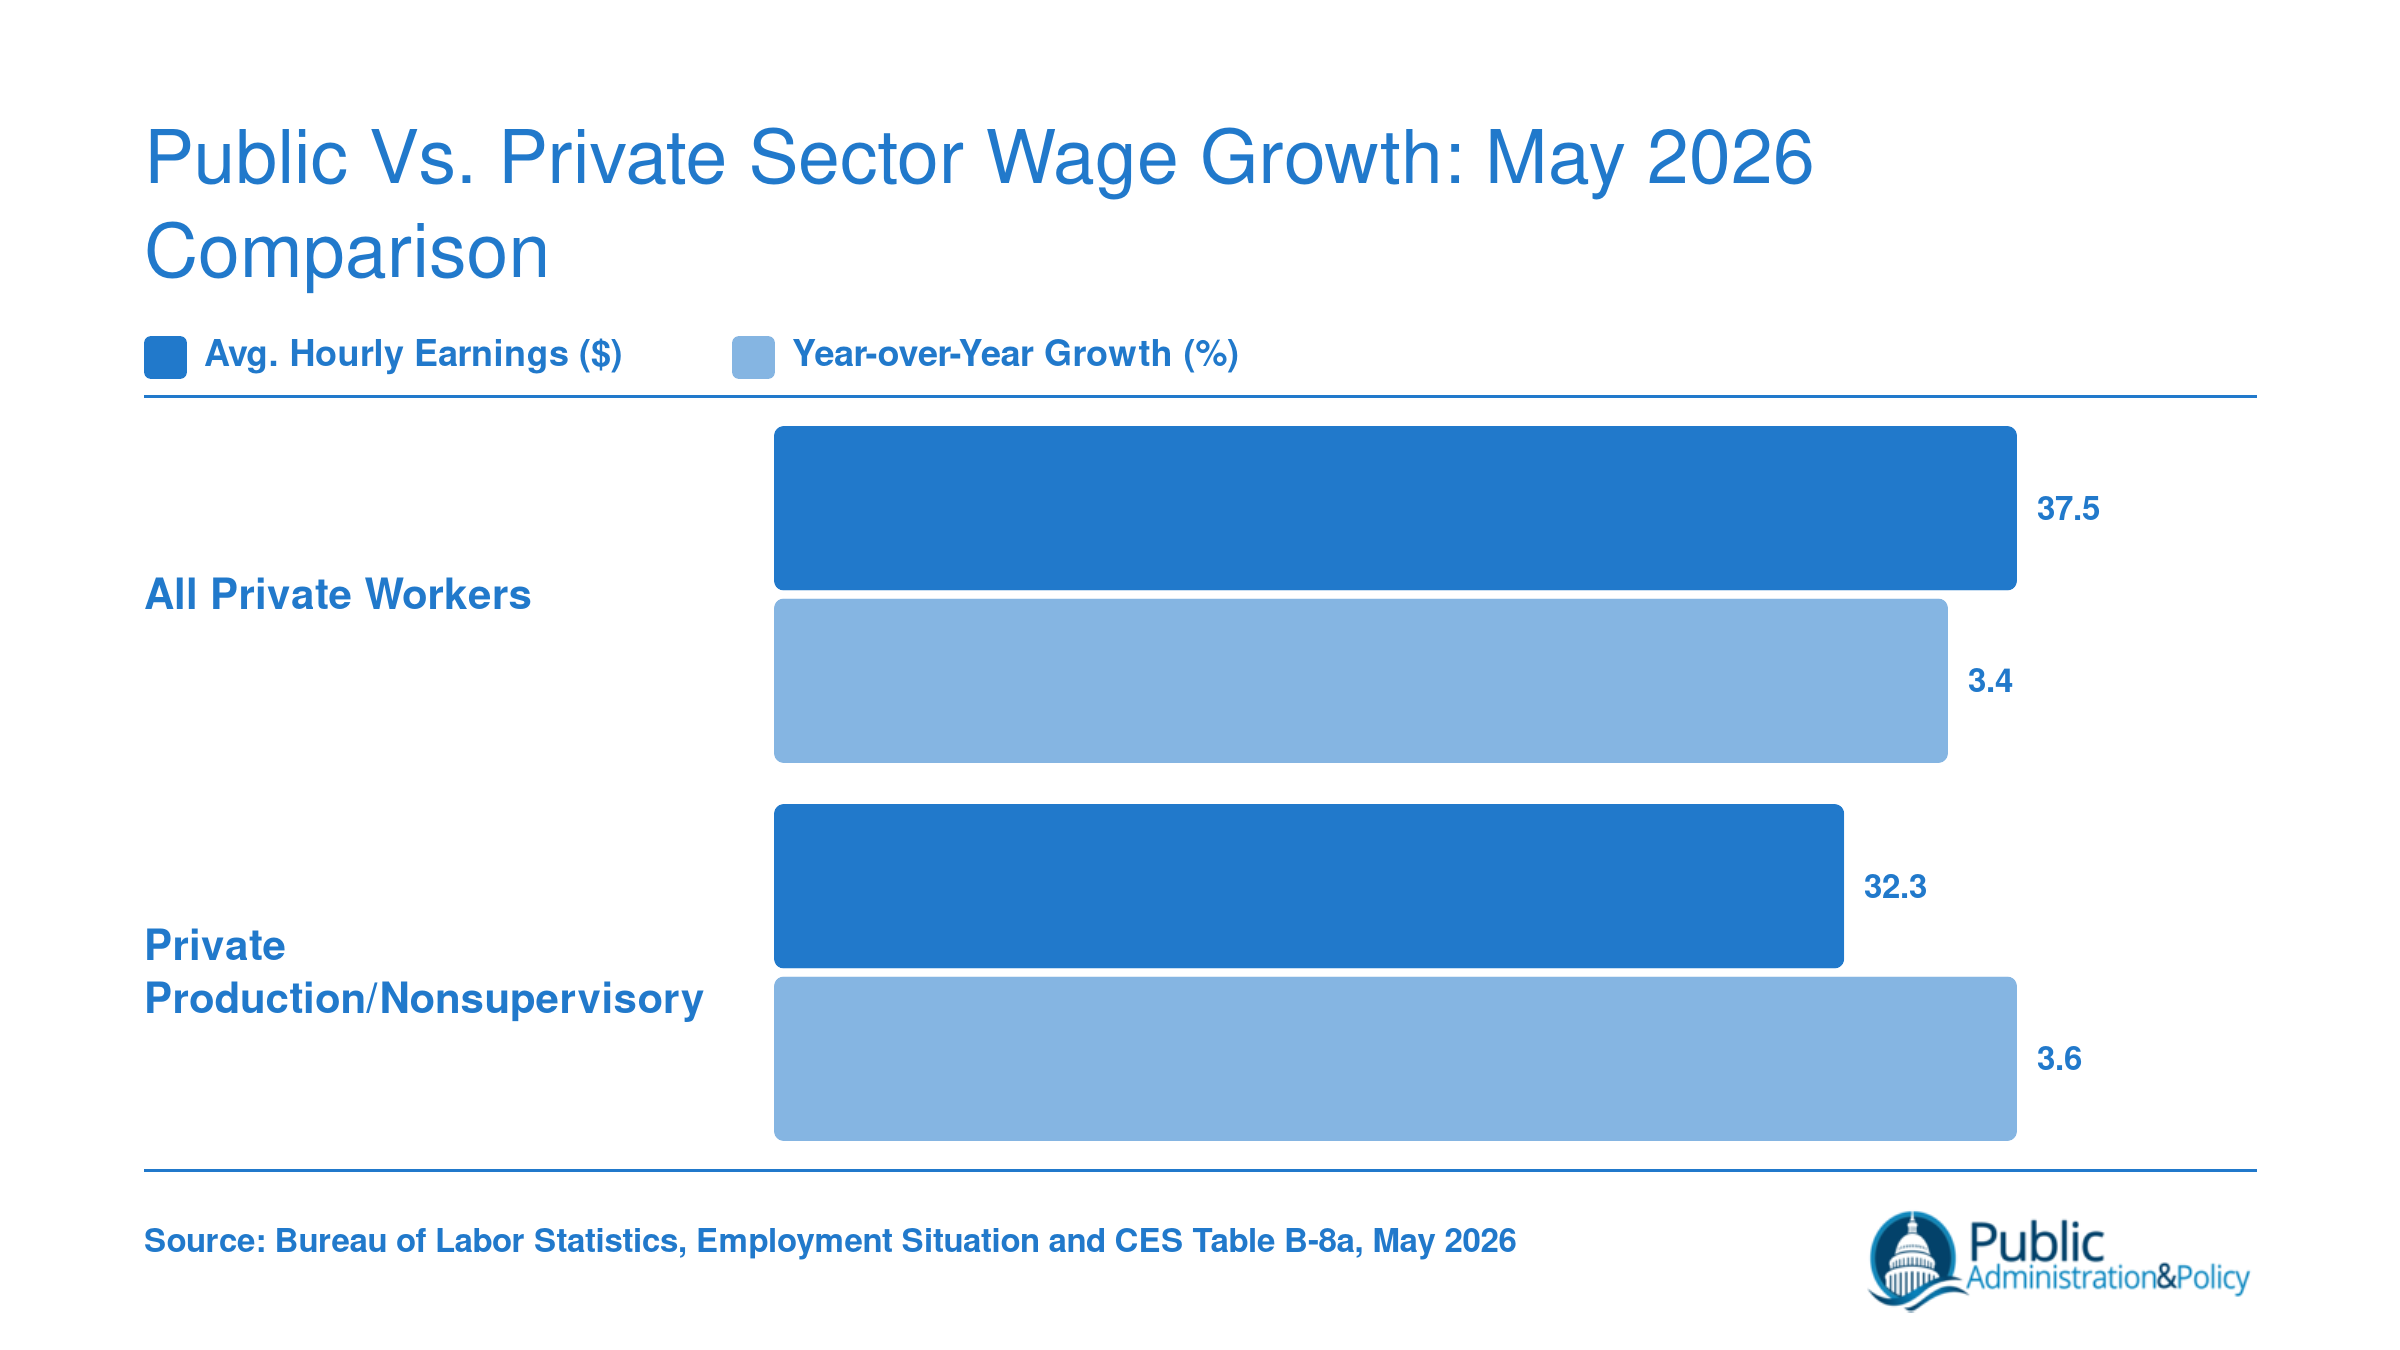
Yet there is a silver lining: the strong labor market boosts income tax and sales tax receipts, improving state and local fiscal health. This creates a feedback loop where governments can afford to raise salaries slightly, though rarely enough to keep pace with private-sector wage growth. For job seekers, this environment demands a dual strategy: highlight the mission-driven aspects of public service while also negotiating for competitive entry-level wages. Agencies that modernize hiring processes and offer flexible work arrangements gain an edge in this tight market.

Implications for Federal Reserve Policy

The Federal Reserve closely monitors employment data as it gauges whether to adjust interest rates. A jobs report heavily skewed toward government hiring presents a puzzle. Public-sector job growth is often less sensitive to monetary policy than private-sector growth because it is driven by budget allocations rather than business cycles. If the Fed interprets the May gains as predominantly government-driven, it may discount the headline number as an indicator of private-sector overheating and remain cautious about further rate hikes.

However, the unemployment rate carries weight because it reflects broad labor market conditions. At 4.3%, the Fed's dual mandate of maximum employment is largely satisfied, but persistent government hiring could add to aggregate demand without boosting productivity. This scenario might complicate inflation projections. If local government wage growth outpaces private wages, as some data suggests for 2026, the Fed could factor public-sector wage pressures into its core services inflation outlook.

In effect, a public-sector-heavy jobs month like May 2026 gives the Fed cover to pause rate adjustments while assessing underlying private-sector trends. For state and local budget planners, this pause means interest rates for municipal bonds may stabilize, making capital projects more affordable. The interplay between employment data and Fed policy thus reverberates through the fiscal tools available to every level of government.

Government employment has followed a dramatic arc since early 2020, plunging sharply at the onset of the pandemic and clawing back unevenly across federal, state, and local tiers. The February 2020 baseline, the last pre-pandemic snapshot, anchors the comparison. While federal payrolls remained relatively stable throughout, state and especially local governments bore the brunt of early layoffs and have taken longer to rebuild. Understanding where May 2026 sits in this trajectory is essential for anyone evaluating career stability or crafting workforce policy in the public sector.

Pre-COVID government employment in thousands: 2,875 federal, 5,178 state, 14,822 local, totaling 22,875 in February 2020

Frequently Asked Questions About the May 2026 Jobs Report and Public Sector Employment

The May 2026 employment data raises important questions for anyone considering or currently building a public sector career. Below are answers to the most common questions we're hearing from students, MPA and MPP candidates, and working professionals in public administration and policy.

Official BLS figures for May 2026 provide the definitive count of government payroll changes at the federal, state, and local levels. Meanwhile, Revelio Public Labor Statistics reported 123,700 total U.S. jobs gained in May across all sectors. The public sector portion of that figure is one lens analysts use, but the BLS Establishment Survey remains the benchmark for government employment totals.

Hiring freezes at the federal level have been a recurring theme in 2026, tied to deficit reduction goals and agency restructuring. May data suggests these freezes remain largely intact at the federal tier, while many state and local governments have moved in the opposite direction, actively recruiting to fill vacancies in education, public safety, and infrastructure. Candidates should track individual agency announcements alongside aggregate data.

Public sector wages have been growing more slowly than private sector compensation in recent years, and that gap persists in mid 2026. However, government roles continue to offer stronger benefits packages, including pensions, health coverage, and student loan repayment programs. When total compensation is considered, the gap narrows considerably, making public service competitive for many professionals.

Local governments face direct, immediate pressure to deliver services such as K through 12 education, emergency response, and utilities. Population growth and infrastructure spending have pushed localities to hire. State governments, meanwhile, have tightened budgets amid slower revenue growth and political pressure to limit headcount. This divergence reflects different fiscal realities and service obligations at each tier.

The Bureau of Labor Statistics uses establishment and household surveys with standardized methodology, released on a set monthly schedule. Revelio Labs draws on alternative sources, including job postings, payroll records, and workforce analytics, often publishing estimates more quickly. For public policy analysts, both are valuable: BLS data offers reliability and historical consistency, while Revelio provides faster signals useful for real time policy adjustments.

Budget analysts, program evaluators, cybersecurity specialists, and public health administrators are among the most in demand government roles in 2026. Local governments are especially seeking planning and zoning professionals to manage infrastructure projects. Candidates with data analysis skills or experience in grants management are well positioned across all levels of government.

Yes. The combination of local government expansion and growing demand for evidence based policy work favors MPA and MPP graduates. These programs emphasize the quantitative, managerial, and analytical competencies that agencies need most right now. Graduates who can bridge data literacy with community engagement are particularly competitive in today's public sector job market.

Recent Articles